Comparative Analysis in Molecular Biology: Understanding Homology and Sequence Alignment
This document explores the importance of comparative analysis in molecular biology, emphasizing sequence alignment as a key method. It discusses homology, illustrating how similarities in gene sequences among diverse organisms suggest a common ancestry. The role of alignment algorithms in modeling evolutionary processes is highlighted, including the mechanisms of mutations, such as substitutions and indels. Understanding these principles helps researchers infer functionally significant sites in proteins and the evolutionary relationships among species. Ultimately, sequence alignment serves as a critical tool for biological discovery.


Comparative Analysis in Molecular Biology: Understanding Homology and Sequence Alignment
E N D
Presentation Transcript
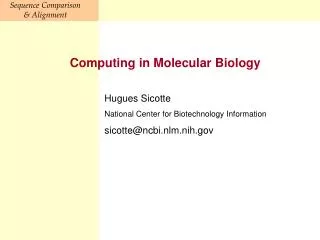
Computing in Molecular Biology Hugues Sicotte National Center for Biotechnology Information sicotte@ncbi.nlm.nih.gov
Finches of the Galápagos Islands observed by Charles Darwin on the voyage of HMS Beagle C O M P A R A T I V E A N A L Y S I S Sequence alignment is similar to other types of comparative analysis Involves scoring similarities and differences among a group of related entities
Homology Homology Is the central concept for all of biology. Whenever we say that a mammalian hormone is the ‘same’ hormone as a fish hormone, that a human gene sequence is the ‘same’ as a sequence in a chimp or a mouse, that a HOX gene is the ‘same’ in a mouse, a fruit fly, a frog and a human - even when we argue that discoveries about a worm, a fruit fly, a frog, a mouse, or a chimp have relevance to the human condition - we have made a bold and direct statement about homology. The aggressive confidence of modern biomedical science implies that we know what we are talking about.” David B. Wake
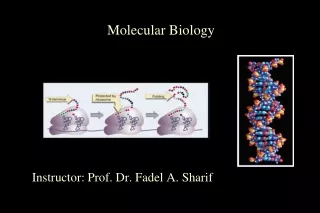
GATGACCA GATTACCA GATTACCA GATTATCA GATTACCA T GATCATCA GATTGATCA GAT ACCA C O M P A R A T I V E A N A L Y S I S GATTACCA Alignment algorithms model evolutionary processes Derivation from a common ancestor through incremental change due to dna replication errors, mutations, damage, or unequal crossing-over. insertion deletion Substitution
C O M P A R A T I V E A N A L Y S I S GATTACCA Alignment algorithms model evolutionary processes GATGACCA GATTACCA GATTACCA GATTACCA GATTATCA GATTACCA Derivation from a common ancestor through incremental change GATCATCA GATCATCA GATTGATCA GATTGATCA GATACCA GATACCA Only extant sequences are known, ancestral sequences are postulated.
C O M P A R A T I V E A N A L Y S I S GATTACCA Alignment algorithms model evolutionary processes GATGACCA GATTACCA GATTACCA GATTATCA GATTACCA Derivation from a common ancestor through incremental change. Mutations that do not kill the host may carry over to the population. Rarely are mutations kept/rejected by natural selection. GATCATCA GATTGATCA GATACCA The term homology implies a common ancestry, which may be inferred from observations of sequence similarity
3000Myr 1000Myr 500Myr Bacteria Yeast Worm Fly Mouse Human Comparative Analysis of Genes Align Extant Sequences MSH2_Human TGVIVLMAQIGCFVPCESAEVSIVDCILARVGAGDSQLKGVSTFMAEMLETASILRSATK SPE1_DROME VGTAVLMAHIGAFVPCSLATISMVDSILGRVGASDNIIKGLSTFMVEMIETSGIIRTATD MSH2_Yeast VGVISLMAQIGCFVPCEEAEIAIVDAILCRVGAGDSQLKGVSTFMVEILETASILKNASK MUTS_ECOLI TALIALMAYIGSYVPAQKVEIGPIDRIFTRVGAADDLASGRSTFMVEMTETANILRNATE *** ** ** * * **** **** * ** * * Human Colon Cancer MSH2 gene is homologous to DNA repair proteins
Why Align sequences? - Finding similar sequences helps determine the properties and function of a new sequence. (Must be verified experimentally) -Conserved positions in homologous sequences hint at functionally important sites in proteins. (active or catalytic sites, dna binding domains, di-sulfide bridges, structural bends, hydrophobic pockets, protein binding domains,…) -Conserved nucleotides can hint at regulatory elements, either pre-transcriptional or post-transcriptional.
Sound alignment methods reflect evolution. DNA Evolution: - Mutation: Errors in DNA replication of DNA repair. -substitutions: replacement of one base by another. -deletions/insertions: By dna mispairing during replication or unequal crossing over. - Gene conversion or unequal crossing over: Large segments of DNA can be inserted/deleted. - Mutations that do not kill the host are propagated. Sometimes positive mutations are selected for. Reference: Molecular Evolution: Wen-Hsiung Li, 1997,Sinauer Associates publishing
Synonymous versus non-synonymous mutations Different regions evolve at different rates, consistent with evolutionary constraints. Substitution rate per nucleotide site per billion years.
Alignment definition and Type: Alignment: Each Base is used at most once. Global Alignment: All bases aligned with another base or with a gap (symbol of “-” or sometimes “.”). G-ATES GRATED Local Alignments: Do not need to align all the bases in all sequences. Align BILLGATESLIKESCHEESE and GRATEDCHEESE G-ATESLIKESCHEESE or G-ATES & CHEESE GRATED-----CHEESE GRATED & CHEESE
C O M P A R A T I V E A N A L Y S I S Insertions and deletions (‘indels’) are represented by gaps in alignments GATTATACCA GATTA---CA gap of length 3
S E Q U E N C E A L I G N M E N T Alignment of trypsin sequences from mouse and crayfish An alignment provides a mapping of residues in one sequence onto those of another S-S * Mouse IVGGYNCEENSVPYQVSLNS-----GYHFCGGSLINEQWVVSAGHCYK-------SRIQV Crayfish IVGGTDAVLGEFPYQLSFQETFLGFSFHFCGASIYNENYAITAGHCVYGDDYENPSGLQI * Mouse RLGEHNIEVLEGNEQFINAAKIIRHPQYDRKTLNNDIMLIKLSSRAVINARVSTISLPTA Crayfish VAGELDMSVNEGSEQTITVSKIILHENFDYDLLDNDISLLKLSGSLTFNNNVAPIALPAQ Mouse PPATGTKCLISGWGNTASSGADYPDELQCLDAPVLSQAKCEASYPG-KITSNMFCVGFLE Crayfish GHTATGNVIVTGWG-TTSEGGNTPDVLQKVTVPLVSDAECRDDYGADEIFDSMICAGVPE * Mouse GGKDSCQGDSGGPVVCNG----QLQGVVSWGDGCAQKNKPGVYTKVYNYVKWIKNTIAAN Crayfish GGKDSCQGDSGGPLAASDTGSTYLAGIVSWGYGCARPGYPGVYTEVSYHVDWIKANAV-- S-S Conserved residues are often of structural or functional importance S-S Figure 7.1
S E Q U E N C E A L I G N M E N T Alignment of trypsin sequences from mouse and crayfish S-S * Mouse IVGGYNCEENSVPYQVSLNS-----GYHFCGGSLINEQWVVSAGHCYK-------SRIQV Crayfish IVGGTDAVLGEFPYQLSFQETFLGFSFHFCGASIYNENYAITAGHCVYGDDYENPSGLQI * Mouse RLGEHNIEVLEGNEQFINAAKIIRHPQYDRKTLNNDIMLIKLSSRAVINARVSTISLPTA Crayfish VAGELDMSVNEGSEQTITVSKIILHENFDYDLLDNDISLLKLSGSLTFNNNVAPIALPAQ Mouse PPATGTKCLISGWGNTASSGADYPDELQCLDAPVLSQAKCEASYPG-KITSNMFCVGFLE Crayfish GHTATGNVIVTGWG-TTSEGGNTPDVLQKVTVPLVSDAECRDDYGADEIFDSMICAGVPE * Mouse GGKDSCQGDSGGPVVCNG----QLQGVVSWGDGCAQKNKPGVYTKVYNYVKWIKNTIAAN Crayfish GGKDSCQGDSGGPLAASDTGSTYLAGIVSWGYGCARPGYPGVYTEVSYHVDWIKANAV-- S-S S-S Conserved positions are often of functional importance. Alignment of trypsin proteins of mouse (Swiss-Prot P07146) and crayfish (Swiss-Prot P00765).Identical residues are highlighted red and underlined. Indicated above the alignment are three disulfide bonds (-S-S-)whose participating cysteine residues are conserved, amino acids whose side chains are involved in thecharge relay system (asterisk) and the active side residue which governs substrate specificity (diamond).Theother conserved positions have no known role. Theseconserved residues could be coincidentally conservedor have some unknown structural role. Figure 7.1
S E Q U E N C E A L I G N M E N T Human zeta crystallin vs E.coli quinone oxidoreductase Stars indicate identical residues and dots indicate conservative substitutions CLUSTAL W (1.7) multiple sequence alignment Human-Zcr MATGQKLMRAVRVFEFGGPEVLKLRSDIAVPIPKDHQVLIKVHACGVNPVETYIRSGTYS Ecoli-QOR ------MATRIEFHKHGGPEVLQA-VEFTPADPAENEIQVENKAIGINFIDTYIRSGLYP : :...:.******: ::: . * :::: :: :* *:* ::****** *. Human-Zcr RKPLLPYTPGSDVAGVIEAVGDNASAFKKGDRVFTSSTISGGYAEYALAADHTVYKLPEK Ecoli-QOR -PPSLPSGLGTEAAGIVSKVGSGVKHIKAGDRVVYAQSALGAYSSVHNIIADKAAILPAA * ** *::.**::. **.... :* ****. :.: *.*:. ... ** Human-ZcrLDFKQGAAIGIPYFTAYRALIHSACVKAGESVLVHGASGGVGLAACQIARAYGLKILGTA Ecoli-QORISFEQAAASFLKGLTVYYLLRKTYEIKPDEQFLFHAAAGGVGLIACQWAKALGAKLIGTV :.*:*.** : :*.* * :: :*..*..*.*.*:***** *** *:* * *::**. Human-ZcrGTEEGQKIVLQNGAHEVFNHREVNYIDKIKKYVGEKGIDIIIEMLANVNLSKDLSLLSHG Ecoli-QORGTAQKAQSALKAGAWQVINYREEDLVERLKEITGGKKVRVVYDSVGRDTWERSLDCLQRR ** : : .*: ** :*:*:** : ::::*: .* * : :: : :.. . .:.*. *.: Human-ZcrGRVIVVG-SRGTIEINPRDTMAKES----SIIGVTLFSSTKEEFQQYAAALQAGMEIGWL Ecoli-QORGLMVSFGNSSGAVTGVNLGILNQKGSLYVTRPSLQGYITTREELTEASNELFSLIASGVI * :: .* * *:: . : ::. : .: : :*:**: : : * : : * : Human-ZcrKPVIGSQ--YPLEKVAEAHENIIHGSGATGKMILLL Ecoli-QORKVDVAEQQKYPLKDAQRAHE-ILESRATQGSSLLIP * :..* ***:.. .*** *:.. .: *. :*: Figure 7.2
Score and Statistics Percent Identity. Can be misleading. Score: A simple quality measure is the “score”. The score assigns points for each aligned base (or gap) of the alignment. identical bases : “match” score mismatching bases: “mismatch” score gaps: “gap opening” penalty for starting a gap “gap extension” penalty for each gap symbol. Example: match = +1 , mismatch =-1, gap opening = -5, gap extension=-1 G-ATESLIKESCHEESE AND/OR G-ATES & CHEESE GRATED-----CHEESE GRATED & CHEESE Score = 10*(+1)+1*(-1)+(-5-1)+(-5+5*(-1)) = -7
S C O R I N G S Y S T E M S Which alignment is “better”? GCTACTAG-T-T--CGC-T-TAGCGCTACTAGCTCTAGCGCGTATAGC 0 mismatches, 5 gaps GCTACTAGTT------CGCTTAGCGCTACTAGCTCTAGCGCGTATAGC 3 mismatches, 1 gap
S C O R I N G S Y S T E M S High penalty for “opening” a gap (e.g. G = 5) GCTACTAG-T-T--CGC-T-TAGCGCTACTAGCTCTAGCGCGTATAGC Penalty = 5G + 6L = 31 Lower penalty for “entending” a gap (e.g. L = 1) GCTACTAGTT------CGCTTAGCGCTACTAGCTCTAGCGCGTATAGC Penalty = 1G + 6L = 11
F12 F2 E F1 E K Catalytic PLAT F1 E K K Catalytic L O C A L S I M I L A R I T Y Protein modules in coagulation factor XII (F12) and tissue plasminogen activator (PLAT) Mix-and-match protein modules confound alignment algorithms F1,F2 Fibronectin repeatsE EGF similarity domainK Kringle domainCatalytic Serine protease activitiy Figure 7.3
F12 F2 E F1 E K Catalytic PLAT F1 E K K Catalytic L O C A L S I M I L A R I T Y Protein modules in coagulation factor XII (F12) and tissue plasminogen activator (PLAT) Mix-and-match protein modules confound alignment algorithms modules inreverse order F1,F2 Fibronectin repeatsE EGF similarity domainK Kringle domainCatalytic Serine protease activitiy Figure 7.3
F12 F2 E F1 E K Catalytic PLAT F1 E K K Catalytic L O C A L S I M I L A R I T Y Protein modules in coagulation factor XII (F12) and tissue plasminogen activator (PLAT) Mix-and-match protein modules confound alignment algorithms repeatedmodules F1,F2 Fibronectin repeatsE EGF similarity domainK Kringle domainCatalytic Serine protease activitiy Figure 7.3
C G T A C C G T A 0 0 0 1 0 0 0 0 C 1 0 0 0 1 1 0 0 G 0 1 0 0 0 0 1 0 T 0 0 1 0 0 0 0 1 D O T P L O T S Dot-plot Fitch : Biochem. Genet. (1969)3,99-108 Horizontal axis is coordinates for one sequence Vertical axis is coordinates for the other Figure 7.4
D O T P L O T S Dot-plot Fitch : Biochem. Genet. (1969)3,99-108 Can also score not 1 position at a time, but in sliding window. For example a window of 3 nucleotides where we score 1 for identical triplets and 0 for all other combinations yields. Horizontal axis is coordinates for one sequence C G T A C C G T A 0 0 0 0 0 0 Vertical axis is coordinates for the other C 1 0 0 0 0 1 G T Figure 7.4b
D O T P L O T S Coagulation Factor XII (F12) Horizontal axis is coordinates for one sequence Vertical axis is coordinates for the other Tissue Plasminogen Activator (PLAT) Figure 7.4
F1 E K K Catalytic F2 E F1 E K Catalytic D O T P L O T S Coagulation Factor XII (F12) Plot dots for high similarity within a short window Adjacent dots merge to form diagonal segments Tissue Plasminogen Activator (PLAT) Figure 7.4
D O T P L O T S Coagulation Factor XII (F12) Repeated domains show a characteristic pattern F1 E K K Tissue Plasminogen Activator (PLAT) Catalytic F2 E F1 E K Catalytic Figure 7.4
90 137 23 72 P A T H G R A P H S Dot plots suggest paths through the alignment space EGF similarity domains of urokinse plasminogen activator (PLAU) and tissue plasminogen activator (PLAT) 90 137 23 Path graphs are more explicit representations Each path is a unique alignment 72 PLAU 90 EPKKVKDHCSKHSPCQKGGTCVNMP--SGPH-CLCPQHLTGNHCQKEK---CFE 137PLAT 23 ELHQVPSNCD----CLNGGTCVSNKYFSNIHWCNCPKKFGGQHCEIDKSKTCYE 72 Figure 7.5
Routing a phone call from Washington DC to San Francisco P A T H G R A P H S Best-path problems are common in computer science A best-path algorithm used for sequence alignment is called ‘dynamic programming’
D Y N A M I C P R O G R A M M I N G Dynamic Programming Example Construct an optimal of these two sequences: G A T A C T A G A T T A C C A Using these scoring rules: Match: +1 Mismatch: -1 Gap: -1
D Y N A M I C P R O G R A M M I N G G A T A C T A Arrange the sequence residues along a two-dimensional lattice G A T T A Vertices of the lattice fall between letters C C A
D Y N A M I C P R O G R A M M I N G G A T A C T A The goal is to find the optimal path G A from here T T A C to here C A
D Y N A M I C P R O G R A M M I N G G A T A C T A Each path corresponds to a unique alignment G A T T Which one is optimal? A C C A
D Y N A M I C P R O G R A M M I N G G A T A C T A The score for a path is the sum of its incremental edges scores G A aligned with A A Match = +1 T T A C C A
D Y N A M I C P R O G R A M M I N G G A T A C T A The score for a path is the sum of its incremental edges scores G A A aligned with T T Mismatch = -1 T A C C A
D Y N A M I C P R O G R A M M I N G G A T A C T A The score for a path is the sum of its incremental edges scores G T aligned with NULL A Gap = -1 T T NULL aligned with T A C C A
D Y N A M I C P R O G R A M M I N G G A T A C T A Incrementally extend the path 0 -1 G -1 +1 A T T A C C A
D Y N A M I C P R O G R A M M I N G G A T A C T A Incrementally extend the path 0 -2 -1 G -1 -2 +1 A Remember the best sub-path leading to each point on the lattice T T A C C A
D Y N A M I C P R O G R A M M I N G G A T A C T A Incrementally extend the path 0 -2 -1 G -1 0 -2 +1 A Remember the best sub-path leading to each point on the lattice +2 0 T T A C C A
D Y N A M I C P R O G R A M M I N G G A T A C T A Incrementally extend the path 0 -2 -1 G -1 0 -2 +1 A Remember the best sub-path leading to each point on the lattice +2 -2 0 T T A C C A
D Y N A M I C P R O G R A M M I N G G A T A C T A Incrementally extend the path 0 -2 -1 -3 G -1 -1 0 -2 +1 A Remember the best sub-path leading to each point on the lattice +2 +1 -2 0 T +1 -3 +3 -1 T A C C A
D Y N A M I C P R O G R A M M I N G G A T A C T A Incrementally extend the path 0 -2 -4 -1 -5 -3 G 0 -1 -1 -2 -3 +1 A Remember the best sub-path leading to each point on the lattice 0 +2 -1 +1 -2 0 T +1 -3 +3 +2 -1 +1 T -2 0 +2 +2 +1 -4 A -1 -5 +1 +3 +2 -3 C C A
0 -6 -2 -4 -7 -1 -5 -3 -4 -1 -5 -1 0 -2 -3 +1 -3 0 +2 -1 +1 -2 -2 0 +1 -1 -3 +3 0 +2 -1 +1 -2 0 +2 +2 +1 +2 -4 +1 -1 -5 +1 +3 +2 +3 -3 +1 -6 +4 +3 +2 -4 -2 0 +2 -5 -7 +3 +3 +2 -1 +1 -3 -8 -4 0 +2 +4 -6 -2 +2 D Y N A M I C P R O G R A M M I N G G A T A C T A Incrementally extend the path G A Remember the best sub-path leading to each point on the lattice T T A C C A
0 -6 -2 -4 -7 -1 -5 -3 -4 -1 -5 -1 0 -2 -3 +1 -3 0 +2 -1 +1 -2 -2 0 +1 -1 -3 +3 0 +2 -1 +1 -2 0 +2 +2 +1 +2 -4 +1 -1 -5 +1 +3 +2 +3 -3 +1 -6 +4 +3 +2 -4 -2 0 +2 -5 -7 +3 +3 +2 -1 +1 -3 -8 -4 0 +2 +4 -6 -2 +2 D Y N A M I C P R O G R A M M I N G G A T A C T A Trace-back to get optimal path and alignment G A T T A C C A
D Y N A M I C P R O G R A M M I N G G A T A C T A Print out the alignment G A G G A A - T T T A A C C T C A A T T A C C A
Two different types of Alignment Global Alignment methods: Needleman & Wunch (J. Mol. Biol. (1970) 48,443-453 : Problem of finding the best path. Revelation: Any partial sub-path that ends at a point along the true optimal path must itself be the optimal path leading to that point. This provides a method to create a matrix of path “score”, the score of a path leading to that point. Trace the optimal path from one end to the other of the two sequences. Smith & Waterman.(J. Mol. Biol. (1981), 147,195-197: Use Needleman &Wunch, but report all non-overlapping paths, starting at the highest scoring points in the path graph. FASTP(Lipman &Pearson(1985),Science 227,1435-1441 BLAST (Altschul et al (1990),J. Mol. Bio. 215,408-410): don’t report all overlapping paths, but only attempt to find paths if there are words that are high-scoring. Speeds up considerably the alignments. Local Alignment methods:
Optimal global alignment Optimal local alignment Needleman & Wunsch (1970) Smith & Waterman (1981) Sequences align essentially from end to end Sequences align only in small, isolated regions G L O B A L & L O C A L S I M I L A R I T Y Implementations of dynamic programming for global and local similarities
Score and Statistics Some amino acids mutations do not affect structure/function very much. Amino acids with similar physico-chemical and steric properties can often replace each other. Scoring system that doesn’t penalize very much mutations to similar amino acid. PAM Matrices: Point Accepted Mutations. Defined in terms of a divergence of 1 percent PAM. For distant sequences use PAM250, while for closer sequences (like DNA) use PAM100. Some sites accumulate mutations some others don’t, thus use of the PAM100 matrice doesn’t mean that the sequences compared were 100% mutated. BLOSUM: BLOCK substitution matrices. Started with the BLOCKS database of multiple alignment only involving distant sequences. BLOSUM62 means that the proteins compated were never closer than 62% Identity. BLOSUM50 matrices involved alignment of more distant sequences. Recommend use BLOSUM matrices (BLOSUM62) for most protein alignments.
S C O R I N G S Y S T E M S A 4 R -1 5 N -2 0 6 D -2 -2 1 6 C 0 -3 -3 -3 9 Q -1 1 0 0 -3 5 E -1 0 0 2 -4 2 5 G 0 -2 0 -1 -3 -2 -2 6 H -2 0 1 -1 -3 0 0 -2 8 I -1 -3 -3 -3 -1 -3 -3 -4 -3 4 L -1 -2 -3 -4 -1 -2 -3 -4 -3 2 4 K -1 2 0 -1 -3 1 1 -2 -1 -3 -2 5 M -1 -1 -2 -3 -1 0 -2 -3 -2 1 2 -1 5 F -2 -3 -3 -3 -2 -3 -3 -3 -1 0 0 -3 0 6 P -1 -2 -2 -1 -3 -1 -1 -2 -2 -3 -3 -1 -2 -4 7 S 1 -1 1 0 -1 0 0 0 -1 -2 -2 0 -1 -2 -1 4 T 0 -1 0 -1 -1 -1 -1 -2 -2 -1 -1 -1 -1 -2 -1 1 5 W -3 -3 -4 -4 -2 -2 -3 -2 -2 -3 -2 -3 -1 1 -4 -3 -2 11 Y -2 -2 -2 -3 -2 -1 -2 -3 2 -1 -1 -2 -1 3 -3 -2 -2 2 7 V 0 -3 -3 -3 -1 -2 -2 -3 -3 3 1 -2 1 -1 -2 -2 0 -3 -1 4 A R N D C Q E G H I L K M F P S T W Y V Some amino acid substitutions are more common than others BLOSUM62 Substitution scores come from an odds ratio based on measured substitution rates Figure 7.8
S C O R I N G S Y S T E M S A 4 R -1 5 N -2 0 6 D -2 -2 1 6 C 0 -3 -3 -3 9 Q -1 1 0 0 -3 5 E -1 0 0 2 -4 2 5 G 0 -2 0 -1 -3 -2 -2 6 H -2 0 1 -1 -3 0 0 -2 8 I -1 -3 -3 -3 -1 -3 -3 -4 -3 4 L -1 -2 -3 -4 -1 -2 -3 -4 -3 2 4 K -1 2 0 -1 -3 1 1 -2 -1 -3 -2 5 M -1 -1 -2 -3 -1 0 -2 -3 -2 1 2 -1 5 F -2 -3 -3 -3 -2 -3 -3 -3 -1 0 0 -3 0 6 P -1 -2 -2 -1 -3 -1 -1 -2 -2 -3 -3 -1 -2 -4 7 S 1 -1 1 0 -1 0 0 0 -1 -2 -2 0 -1 -2 -1 4 T 0 -1 0 -1 -1 -1 -1 -2 -2 -1 -1 -1 -1 -2 -1 1 5 W -3 -3 -4 -4 -2 -2 -3 -2 -2 -3 -2 -3 -1 1 -4 -3 -2 11 Y -2 -2 -2 -3 -2 -1 -2 -3 2 -1 -1 -2 -1 3 -3 -2 -2 2 7 V 0 -3 -3 -3 -1 -2 -2 -3 -3 3 1 -2 1 -1 -2 -2 0 -3 -1 4 A R N D C Q E G H I L K M F P S T W Y V Identities get positive scores, but some are better than others BLOSUM62 Figure 7.8
S C O R I N G S Y S T E M S A 4 R -1 5 N -2 0 6 D -2 -2 1 6 C 0 -3 -3 -3 9 Q -1 1 0 0 -3 5 E -1 0 0 2 -4 2 5 G 0 -2 0 -1 -3 -2 -2 6 H -2 0 1 -1 -3 0 0 -2 8 I -1 -3 -3 -3 -1 -3 -3 -4 -3 4 L -1 -2 -3 -4 -1 -2 -3 -4 -3 2 4 K -1 2 0 -1 -3 11 -2 -1 -3 -2 5 M -1 -1 -2 -3 -1 0 -2 -3 -2 12 -1 5 F -2 -3 -3 -3 -2 -3 -3 -3 -1 0 0 -3 0 6 P -1 -2 -2 -1 -3 -1 -1 -2 -2 -3 -3 -1 -2 -4 7 S 1 -1 1 0 -1 0 0 0 -1 -2 -2 0 -1 -2 -1 4 T 0 -1 0 -1 -1 -1 -1 -2 -2 -1 -1 -1 -1 -2 -1 1 5 W -3 -3 -4 -4 -2 -2 -3 -2 -2 -3 -2 -3 -1 1 -4 -3 -2 11 Y -2 -2 -2 -3 -2 -1 -2 -3 2 -1 -1 -2 -1 3 -3 -2 -2 2 7 V 0 -3 -3 -3 -1 -2 -2 -3 -3 31 -2 1 -1 -2 -2 0 -3 -1 4 A R N D C Q E G H I L K M F P S T W Y V Some non-identities have positive scores, but most are negative BLOSUM62 Figure 7.8