Download

1 / 19
190 likes | 307 Vues
Explore how z-scores and probabilities apply to sample means in statistics. Learn to compute z-scores, identify distributions, and calculate standard errors. Understand criteria for normal distribution and accuracy of sample means.

E N D
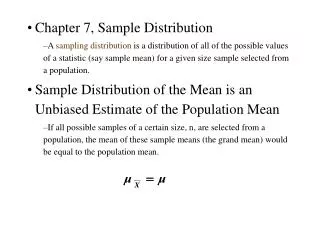
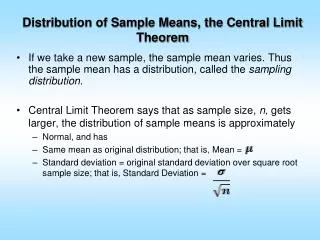
The Distribution of Sample Means • In Chapter 7 we extend the concepts of z-scores and probability to samples of more than one score. • We will compute z-scores and find probabilities for sample means. • To accomplish this task, the first requirement is that you must know about all the possible sample means, that is, the entire distribution of Ms.
The Distribution of Sample Means (cont.) • Once this distribution is identified, then 1. A z-score can be computed for each sample mean. The z-score tells where the specific sample mean is located relative to all the other sample means. 2. The probability associated with a specific sample mean can be defined as a proportion of all the possible sample means.
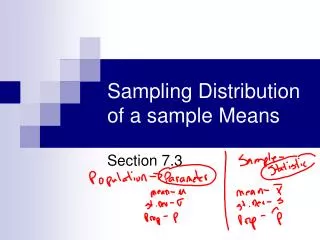
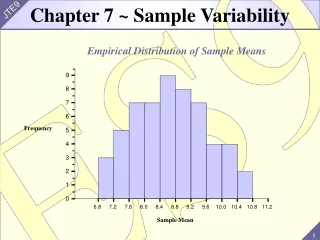
The Distribution of Sample Means (cont.) • The distribution of sample means is defined as the set of means from all the possible random samples of a specific size (n) selected from a specific population. • This distribution has well-defined (and predictable) characteristics that are specified in the Central Limit Theorem:
The Central Limit Theorem 1. The mean of the distribution of sample means is called the Expected Value of M and is always equal to the population mean μ. • The standard deviation of the distribution of sample means is called the Standard Error of M and is computed by σσ2 σM = ____ or σM = ____ n n 3. The shape of the distribution of sample means tends to be normal. It is guaranteed to be normal if either a) the population from which the samples are obtained is normal, or b) the sample size is n = 30 or more.
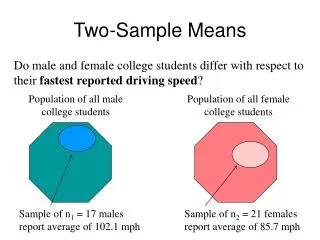
The Distribution of Sample Means (cont.) The concept of the distribution of sample means and its characteristics should be intuitively reasonable: 1. You should realize that sample means are variable. If two (or more) samples are selected from the same population, the two samples probably will have different means.
The Distribution of Sample Means (cont.) 2. Although the samples will have different means, you should expect the sample means to be close to the population mean. That is, the sample means should "pile up" around μ. Thus, the distribution of sample means tends to form a normal shape with an expected value of μ. 3. You should realize that an individual sample mean probably will not be identical to its population mean; that is, there will be some "error" between M and μ. Some sample means will be relatively close to μ and others will be relatively far away. The standard error provides a measure of the standard distance between M and μ.
z-Scores and Location within the Distribution of Sample Means • Within the distribution of sample means, the location of each sample mean can be specified by a z-score, M – μ z = ───── σM
z-Scores and Location within the Distribution of Sample Means (cont.) • As always, a positive z-score indicates a sample mean that is greater than μ and a negative z-score corresponds to a sample mean that is smaller than μ. • The numerical value of the z-score indicates the distance between M and μ measured in terms of the standard error.
Probability and Sample Means • Because the distribution of sample means tends to be normal, the z-score value obtained for a sample mean can be used with the unit normal table to obtain probabilities. • The procedures for computing z-scores and finding probabilities for sample means are essentially the same as we used for individual scores
Probability and Sample Means (cont.) • However, when you are using sample means, you must remember to consider the sample size (n) and compute the standard error (σM) before you start any other computations. • Also, you must be sure that the distribution of sample means satisfies at least one of the criteria for normal shape before you can use the unit normal table.
The Standard Error of M • The standard error of M is defined as the standard deviation of the distribution of sample means and measures the standard distance between a sample mean and the population mean. • Thus, the Standard Error of M provides a measure of how accurately, on average, a sample mean represents its corresponding population mean.
The Standard Error of M (cont.) • The magnitude of the standard error is determined by two factors: σ and n. • The population standard deviation, σ, measures the standard distance between a single score (X) and the population mean. • Thus, the standard deviation provides a measure of the "error" that is expected for the smallest possible sample, when n = 1.
The Standard Error of M (cont.) • As the sample size is increased, it is reasonable to expect that the error should decrease. • The larger the sample, the more accurately it should represent its population.
The Standard Error of M (cont.) • The formula for standard error reflects the intuitive relationship between standard deviation, sample size, and "error." σ σM = ——— n • As the sample size increases, the error decreases. As the sample size decreases, the error increases. At the extreme, when n = 1, the error is equal to the standard deviation.