Download
1 / 12
120 likes | 311 Vues
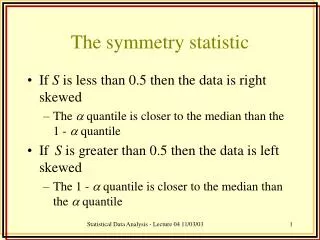
Introduction to the t-statistic. Chapter 9. The problem with z-scores. Formula = mean of sample, minus what mean of population would be if the null were true, all divided by the standard error of the mean

E N D
Introduction to the t-statistic Chapter 9
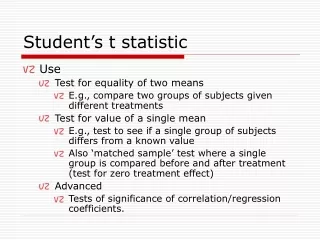
The problem with z-scores • Formula = mean of sample, minus what mean of population would be if the null were true, all divided by the standard error of the mean • Standard error of the mean = standard deviation of population, divided by square root of sample size • Problem = don’t know standard deviation of population
Estimating standard error of the mean • Think back to two different standard deviation formulas – • s vs S • S provides estimate of standard deviation of population • Can then use this to estimate the standard error of the mean
A new standard error of the mean • Plain old standard error of the mean = standard deviation of the population divided by square root of sample size • Estimated standard error of the mean = estimate of standard deviation of the population divided by square root of sample size • Can also think of as square root of estimate of variance of the population divided by sample size • Formulas from here on out will use variance rather than standard deviation good to get used to
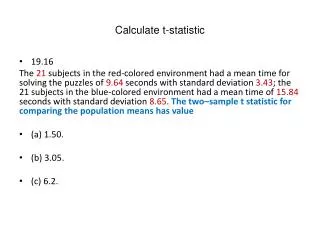
Estimated rather than exact standard error of the mean new formula • Can no longer use z-score formula, since that assumes population standard deviation is known • To test hypotheses about the mean of one group compared to what the mean of the population would be if the null were true, use t formula • Exactly the same as z, but standard error of the mean is replaced by estimated standard error of the mean • Mean of sample, minus what the mean of the population would be if the null hypothesis was true, divided by the estimated standard error of the mean
A new test, a new table • To interpret t-scores, need to use the t-table • Appendix B, page 531 • Gives df (degrees of freedom – n-1), and critical values that divide the normal curve according to different alpha values, and whether the test is one-tailed or two-tailed
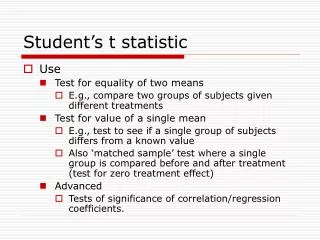
More information on the t-test • This t-test referred to as one-sample t-test • Allows hypotheses about the mean of a group, compared to some meaningful value, to be tested • Meaningful value could come from mean of some known population, or from the possible values of the scale being used, or from meaningful values related to the scale being used
Reporting t-statistic • Unlike z-statistic, the t-statistic is found in journal articles • APA style to report: • t (df) = calculated t value, p information
Interpreting t-statistic • Value of the t statistic tells you how many estimated standard errors of the mean separate the mean of your sample from what the mean of the population would be, if the null hypothesis was true
Don’t forget effect size! • Can compute Cohen’s d: • Mean of sample minus what the mean of the population would be if the null hypothesis was true divided by the standard deviation of the sample • (M-m)/s • Tells how many standard deviations separate the mean of the sample from what the mean of the population would be if the null hypothesis was true
Another way of thinking about effect size • r2: how much do you know about one thing, just by knowing something else? • AKA percentage of variance explained • Calculated by how much variability is accounted for, divided by total amount of variability • t2/(t2+df) • Gives value between 0 and 1
Keep in mind • When you can use the one-sample t-test • What information it gives