
Uploaded by
loan
1 SLIDES
162 VUES
10LIKES
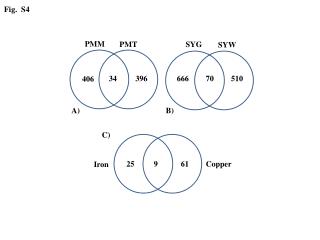
Analysis of Copper and Iron in PMM and PMT: Insights from Fig. S4
DESCRIPTION
This study examines the variations in Copper and Iron concentrations in the PMM and PMT samples as illustrated in Fig. S4. Key findings include the comparison of elemental composition and the implications of the observed values, specifically focusing on the thresholds of 34.396, 406.25, and 9.61. The results contribute valuable data for understanding the material properties and potential applications in various fields.
Download
1 / 1
Télécharger la présentation 
Analysis of Copper and Iron in PMM and PMT: Insights from Fig. S4
An Image/Link below is provided (as is) to download presentation
Download Policy: Content on the Website is provided to you AS IS for your information and personal use and may not be sold / licensed / shared on other websites without getting consent from its author.
Content is provided to you AS IS for your information and personal use only.
Download presentation by click this link.
While downloading, if for some reason you are not able to download a presentation, the publisher may have deleted the file from their server.
During download, if you can't get a presentation, the file might be deleted by the publisher.
E N D


More Related