Download
1 / 56
560 likes | 693 Vues
This comprehensive guide explores the complexities of exchange rates, highlighting how domestic currencies are affected by foreign trade and investment. It discusses various strategies for currency exchange, such as uncovered interest parity and its implications for investors. Additionally, the article examines factors influencing currency supply and demand, including government policies and market responses. With insights into the balance of payments and the forex market, this resource is vital for understanding the intricate relationships between currencies in a globalized economy.

E N D
“I’ve watched year in and year out as companies have shut down and people have lost their jobs because China has not played by the same rules, in part by holding down artificially the value of their currency,” Mitt Romney 2012
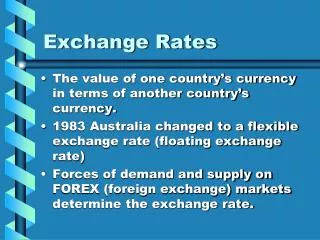
Exchange Rates • Exchange Rate: S - # of domestic currency units purchased for 1 US$. • An increase in S is a depreciation of domestic currency and a decrease in S is an appreciation.
Saving It is January 1st, and you have D$1000 to save for 1 year. You can put it into: • a domestic currency bank account at an interest rate i. • a foreign currency bank account at interest rate iF.
Payoff to strategy #2 • Strategy two has three parts. • Buy foreign exchange at spot rate S01/01to get {D$1000/S01/01} F dollars. • Put {D$1000/S01/01} F dollars into F bank account. After 1 year get F$(1+iF)×{D$1000/S01/01 } • Convert these funds into F$ at exchange rate prevailing at end of year.
Uncovered Interest Parity • If , deposit funds then deposit in F$ account. • If , deposit funds then deposit in D$ account. • Then in equilibrium
Interest Rate Parity • The only reason people would be willing to hold a US$ account when US interest rates were lower than domestic interest rates would be if they can achieve an expected gain from an increase in the value of US$ during the time that they were holding the account. • Approximately
Three Reasons UIRP might not hold • Future exchange rates are risky, uncovered interest parity does not account for risk. • Interest Parity Works for Forward Prices Forward Price for currency delivered at t+1 • Domestic and foreign currency not perfect substitutes. People like to hold currency for liquidity reasons. • Currency controls
Why do exchange rates change? • Relative values of two currency determined by supply and demand by traders of the two currencies. Unlike textbook, we will describe a model of domestic country’s forex market in which US$ is vehicle currency • Price of US$: S is the price of US$ in terms of DCU. Link
From Interest Parity • People trade currencies to engage in foreign trade and international investment. • Expected (Investment) Profit: • Of Domestic Investors in Foreign Economy • Of Foreign Investors in Domestic Economy
Consider the spot foreign exchange market. • Supply of US$:People who want to acquire DCU to buy domestic goods or assets. Substitution Effects When US$ becomes expensive, domestic goods or assets get cheap and foreign investors are attracted to domestic currency. • Expected Profit Effect - e.g. Expensive US$ magnifies returns on domestic accounts • Exports Effect – Expensive US$ reduces the attractiveness of exports.
Demand for US$: Domestic people who want to acquire US$ for foreign purchases or overseas investment. Substitution Effects: When US$ get cheap, US$ goods or assets get cheap and demand for US$ rises • Expected Profit Effect - e.g. Cheap US$ magnifies returns on foreign accounts • Imports Effect – Cheap US$ reduces the competitiveness of imports.
Supply and Demand in Forex Mkt S Supply BoP > 0 BoP < 0 Demand Forex Turnover
Equilibrium in the Forex Market • Gap between supply and demand of US$ is the Balance of Payments. • Two types of Forex Markets • Floating: Forces of supply and demand equilibrate markets. • Fixed: Gov’t/Central Bank buys excess foreign currency in market.
Equilibrium with Floating Rates S Supply S ⓪ S* S Demand Forex Purchas
Increase in Desired Capital Inflows by Foreign Investors/ Desired Purchases of Domestic Goods S Supply Supply' ⓪ S* Domestic Currency Appreciates S** ① Demand
Increase in Desired Capital Outflows by Domestic Investors/ Desired Purchases of Foreign Goods S S** Domestic Currency Depreciates ① S* ⓪ Demand ' Supply Demand
Fixed Exchange Rate: Weak Currency Target S Gov’t Buys Excess Supply US$ Supply STGT BoP > 0 Demand Forex Turnover
Fixed Exchange Rate: Strong Currency Target S Supply BoP < 0 STGT Demand Gov’t Buys Excess DCU Forex Turnover
De Facto Classification of Exchange Rate Regimes and Monetary Policy Frameworks
Balance of Payments Crisis • Basic asymmetry between weak and strong currency target. • Weak target: Govt has infinite amount of domestic currency and can always maintain. • Strong target: Govt has finite amount of foreign currency and may face a balance of payments crisis. • BoP crisis: Gov’t must borrow funds from abroad or allow a weakening of the currency.
China Forex Market: Excess Supply of US • Trade Surplus: Chinese exporters bringing cash home can sell foreign currency at policy rate to SAFE. • Capital &Currency Controls: Non-trivial to move money into China and even harder to move it out. Govt policies to encourage FDI inflows and discourage portfolio outflows. • Exchange Rate Policy: Crawling Peg
China Forex : Supply and Demand less sensitive to exchange rate or interest differentials. S Supply STGT Demand
China State Administration Foreign Exchange Safe through 2011 has accumulated large quantities of foreign reserve assets. Link
Foreign Currency InterventionSterilized vs. Unsterilized Two ways of financing interventions • Foreign currency purchase: • Central bank purchases foreign currency • Unsterilized: Create additional domestic currency liquidity • Sterilized: Borrow domestic currency from banks, govt, selling bonds. • Foreign currency sale • Central bank sells foreign currency • Unsterilized: Withdraw domestic currency liquidity • Sterilized: Repay domestic currency loans.
Benchmark: PPP • The first theory of exchange rates was Purchasing Power Parity – Arbitrage should insure the price of goods was equalized across countries • Is PPP true? Not in short run. Trade arbitrage does not work that fast. How about long run?
Exchange Rate MisalignmentOver-valuation/Undervaluation of Currency • Exchange rate misalignment: when price of currency differs from relative prices of goods making domestic goods relatively cheap/competitive or relatively expensive/uncompetitive
Real Exchange Rate: Measure of Competitiveness • We can measure the competitive pricing of home goods. • Numerator: # of domestic currency units needed to by the # of foreign currency units needed to buy 1 foreign good. • Denominator: # of domestic currency units needed to buy 1 domestic good
Is the Currency Undervalued or Overvalued? • When RER is weak (i.e. when currency is undervalued), domestic exports are competitive on global markets while foreign imports may be less attractive. • For any pair of currencies, it is easy to observe the exchange rate, but what is the relative price we should consider when thinking about the competitiveness of currency?
Effective Exchange Rate Indices • IMF constructs effective exchange rate indices both nominal and real. • Indices are constructed so the growth rate of the index is equal to a weighted average of bilateral appreciation rates How about the long run?
Competitiveness & Current Account IMF Data Mapper
Construct an international market basket of goods produced and purchased around the world. For country j, PPPjcould be the relative price of the market basket relative to price of the market basket in US$. Problem: Judging the cost of living by the cost of the international market basket may not be fair if customers in the local market can buy the types of goods which are cheaper at home. Market Basket Index?
Major project to compare prices internationally implemented by the World Bank with the help of UN and national statistical agencies. • ICP has been implemented by UN Statistical Office since 1968. Link
Divide expenditures into k = 1,..,K (in 2005, K = 155) “basic heading” categories of goods. All j = 1,..J countries (in 2005, J = 146) report total expenditure in domestic currency of all kcategories. Sample prices of representative goods from each category in each country. Construct average of those prices (relative to “anchor” economy) for each country j basic heading type of good k . Relative Prices
PPP is the relative price of goods in one country measured in its own currency compared to the price of a reference country. Example: If Big Macs were k and cost HK$18.90 in HK and US$3.71 in USA, then PPP: Purchasing Power Parities
WDI provides PPP data for many countries using US$ as anchor currency International Comparison Project Hong Kong PPP per Category
PPP in Anchor Currency. • Define quantity of good of type k valued • Calculate price of j’s market basket in j’s prices relative to price of j’s market basket in anchor country prices. Numerator in j currency, denominator in US$
Conceptually PPP is the cost of the goods purchased by consumers in their country relative to the cost of those same goods in US$ terms.
PPP 2010 World Development Indicators
PPP’s are used to construct comparable measures of GDP for multiple countries by converting them into international dollars. GDP in Intl$ Per capita GDP in international dollars is headline way of comparing living standards. World Development Indicators
Developing countries tend to be relatively cheap with PPP’s being lower than exchange rates. • OECD countries tend to have more similar price structures, though they tend to be relatively more expensive. • High income, non-OECD countries tend to be relatively cheap. • Compare values measured in different currencies using the PPP and exchange rate method.