Download
1 / 48
480 likes | 629 Vues
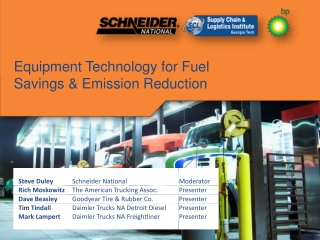
Equipment Technology for Fuel Savings & Emission Reduction. Fuel economy has been a constant priority, and a requirement to compete as a low-cost provider of services. The impact of change is new; the effort and drive to improve has continued for 30 years. Key sustainment actions

E N D
Fuel economy has been a constant priority, and a requirement to compete as a low-cost provider of services. The impact of change is new; the effort and drive to improve has continued for 30 years • Key sustainment actions • Driver training and management • Equipment specs • Equipment controls • Supplier decisions
Significant progress has occurred; factors have offset some gains. • Competition for drivers • Requirement to lower diesel emissions
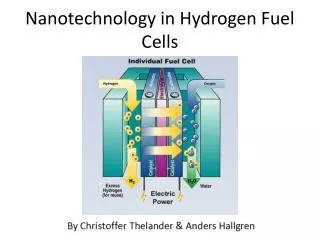
Fundamentals of mpg. • Factors for fuel consumption: • Air Resistance • Rolling Resistance • Power Train Power Demand Power Creation and Delivery
Fundamentals of mpg: Power demand vehicle speed and road load horsepower. Linehaul tractors operate at about 60 mph 50% of operating time
Factors affecting truck fuel economy (fundamentals). Idling Zero Idling Time vs = 7-10% 50% Idling Time Driver Best Driver vs = up to 35% Worst Driver Weather Winter No Headwind vs = 8-12% vs = 5-10% Summer 5 mph Headwind Speed 55 mph vs = 15% 65 mph Load 80,000 lbs vs = 5% 70,000 lbs Route Flat Interstate Highway vs = 4-18% Mountainous Interstate Tire Inflation 100 psi vs = up to 2% 80 psi
Each design factor is influenced by purchase and operation decisions.
Each design factor is influenced by purchase and operation decisions.
Each design factor is influenced by purchase and operation decisions.
Equipment Technology and Advancements to Conserve Fuel within Scope of Legislative and Regulatory Mandates Richard Moskowitz Vice President, Regulatory Affairs Counsel September 23, 2008 Fuel Conservation and Management Symposium
2002 Emissions Standards (EGR) 2006 ULSD 2007 PM traps 2010 Additional NOx Controls (SCR) 1994 5.0 Electronic fuel control 1998 4.0 EGR 2002 NOx (g/hp-hr) 2.5 2007 1.2 Increased EGR w / DPF 0.2 2010 EGR w/Urea injection 0.0 PM (g/hp-hr) 0.01 0.0 0.10 Relationship Between EPA’s Diesel Emissions Regulations and Fuel Economy has been Negative Fuel Conservation and Management Symposium
Can Congress Solve the Energy Crisis? Comprehensive Solution Needed: Drill – Increase Supply Conserve – Reduce Demand Orderly Markets – Government Oversight Opportunities: Energy Legislation (55 bills) Highway Reauthorization (2009) Fuel Conservation and Management Symposium
ATA’s Sustainability Initiatives Control Speed (Highway Reauthorization) 1/10 mpg for each 1 mph Enact 65 mph national speed limit Govern new trucks at 68 mph maximum speed 65 mph for trucks*: 2.8 billion gallons of diesel fuel 31.5 million tons of CO2 * Over 10 years • 65 mph for all vehicles*: • 8.7 billion gallons of gasoline • 84.7 million tons of CO2 Fuel Conservation and Management Symposium
ATA’s Sustainability Initiatives Reduce Main Engine Idling (Gang of 10) 40 state/municipal regulations (GA, NC, PA) .8 gallons per hour Financial Incentives Waive FET (12%) Provide tax incentives Weight exemption (32 states) Truck idling consumes 1.1 billion gallons of diesel annually 13.3 million tons of CO2 annually Fuel Conservation and Management Symposium
ATA’s Sustainability Initiatives Address Congestion (Highway Bill) 4.2 billion hours/year sitting in traffic 2.9 billion gallons of fuel Invest in infrastructure Gas Tax (1% - 2% cost) No Tolls (20%-30% cost) • Eliminating 437 key congestion bottlenecks could save trucking companies: • 4.1 billion gallons of fuel over a 10 years • 45.2 million tons of CO2 emissions annually Fuel Conservation and Management Symposium
ATA’s Sustainability Initiatives Improve Fuel Efficiency (Energy Legislation) Voluntary Market Based Incentives Constant Improvement (3 year plans) Funding dropped from $3M to $2M in ‘08 SmartWaysm Benefits: 554 million gallons annually 48M tons CO2 by 2012 Fuel Conservation and Management Symposium
ATA’s Sustainability Initiatives Enhance Truck Productivity(Highway Reauthorization) Lower consumption by reducing the number of trucks needed to move freight Size and Weight Reform • Allowing heavier double 33-foot trailers could save: • 20.5 billion gallons of diesel over 10 years • 227.3 million tons of CO2 Fuel Conservation and Management Symposium
ATA’s Sustainability Initiatives Increase Fuel Economy Standards Historical Tradeoff NAS study Technologically Feasible Economically Feasible Maintain Performance Adequate Lead Time Fuel Conservation and Management Symposium
Looking to the FutureThe Greenwashing of Public Opinion Massachusetts v. EPA EPA ANPRM (GHG Emissions) – Future Mandates Aerodynamic Standards Heat Recovery Low Viscosity Lubricants Alternative Fuels Hybrid Technologies Automatic Tire Inflation Climate Change – Greenhouse Gas Controls Carbon Tax Low Carbon Fuel Standard Cap & Trade Lieberman/Warner Bill ($3 trillion dollars) Moderated / Derailed by dramatically higher fuel costs ATA Position – no double counting Presidential Politics Fuel Conservation and Management Symposium
Improving Truck Fuel Technology Dave Beasley Director, Commercial Tire Sales
Tire rolling resistance. • ROLLING RESISTANCE is the energy loss resulting from sidewalldeflection and tread deformation Load Deflection – tire sidewall flexes outward Deformation – tread in the contact patch is compressed and deformed Improving tire rolling resistance can reduce fuel consumption.
Each wheel position contributes to rolling resistance. Drive and trailer tires account for over 85% of total rolling resistance.
Various tire components contribute to rolling resistance. Fuel efficiency improvements come primarily from the tire tread.
Tire tread research focuses on two areas to improve rolling resistance. Tread Design Optimization Tread designs that reducetread element deformations Tread Rubber Compounds Compounds that reduce tread element compression and deformation Tread designs and compounds work together to meet performance objectives.
New tires and retreads with Fuel Max™ technology. Up to 4%* actual on-highway fuel savings with strong mileage andperformance for the life of the tire. * In comparison with standard Goodyear tires. Results may vary.
Goodyear continues to improve tire fuel efficiency. 1980’s 1990’s Today’s FE Future FE Technology Technology Technology Technology The next generation of Fuel Max products will provide even greater fuel savings.
Rolling resistance will not be the only improvement. Current Technology Target Future Technology Target Current Product New Product Next generation tires will be designed to enhance overall performance.
Tire and truck maintenance remains important. Tire Inflation Axle Alignment Prevent fuel economy losses with proper tire and truck maintenance.
After fuel cost, fleet managers say their largest uncontrollable issue is on-road tire failures. • Nearly 2/3 of on-highway tire failures come from the trailer position • The G316 trailer tire with DuraSeal Technology® has a built-in tire sealant that quickly seals up to ¼” diameter tread punctures in the tread area Improve uptime and reduce repair costs with DuraSeal Technology®.
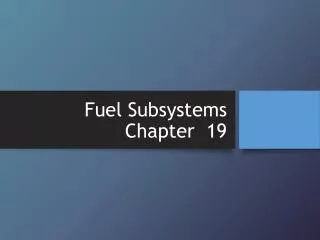
Engine Manufacturers Perspective Fuel Conservation and Management Symposium
Detroit Diesel Engines Emission Control Timeline Cooled Exhaust Gas Recirculation Selective Catalytic Reductant Systems Emissions Controlled through fuel injection timing Particulate Filters 1990 2000 2010 Increased fuel consumption Improving fuel consumption Improving fuel consumption Fuel Conservation and Management Symposium
Detroit Diesel Engines • In the beginning of 2000, it was determined a another advancement in engines was needed • Detroit Diesel, now part of Daimler began development of a brand new line of heavy duty engines • Once again the focus was fuel economy and emission reduction as the 2007 emission standards were now clearly defined • Investment of $1.5 Billion has bought this engine family to the market beginning in January 2008 Fuel Conservation and Management Symposium
DD15 Fuel Consumption vs. S60 Fuel Consumption Advantage DD15 Advantage S60 The new DD15 is the industry leader in fuel efficiency Fuel Conservation and Management Symposium Source:
SCR System for 2010 2007 Emissions 2010 Emissions Fuel Conservation and Management Symposium
2010 Aftertreatment Design Concept Fuel Conservation and Management Symposium
2010 Aftertreatment Design Concept 2. Fluid Savings from SCR 3. DEF Pricing Relative to Diesel 1. Diesel Fuel Savings $11,430 SCR Fuel Savings Per Truck @ 3% = 583 gallons/yr @ 4% = 769 gallons/yr @ 5% = 952 gallons/yr DEF Price = $2.50 Diesel Price = $5.00 $7,500 3% fuel savings $3,800 5% fuelsavings $2,000 $0 1 yr. 2 yr. 3 yr. There Are 3 Factors In SCR Economics SCR Benefits Will Rapidly Overcome Upfront Cost Increases and “Complexity” Challenges Fuel Conservation and Management Symposium
Other Factors Impacting Fuel Consumption • Drivers have a significant impact on vehicle fuel consumption • Numerous engine control strategies are employed to control the drivers influence on fuel consumption • Vehicle Speed Limiting • Cruise Control Incentives • Progressive Shifting Engine Speed Controls • Engine Idle Time Limiters • Cooling Fan Control Strategies • “Soft” Cruise Control • Adaptive Cruise Control – anticipate topography changes (future technology) Fuel Conservation and Management Symposium
Future Fuel Economy Improvements Future Fuel Economy Improvements beyond 2010 will come in small increments Attention to aerodynamic detail in both tractor and trailer Incremental electronic controls to further optimize drivelines Continued small increments in basic engine efficiency Fuel Conservation and Management Symposium
Reduced Fleet (Fuel) Operating Costs Mark Lampert Sr. VP Sales Daimler Trucks North America
Fuel Energy Distribution • A modern Long Haul Class 8vehicle operating on a typicalU.S. round trip with a GVW of80,000 lb utilizes fuel energyas follows: * Influenced by driving technique
Optimize Fuel Consumption – Engine & Engine Based Auxiliary Loads DD15 - TURBO COMPOUND • Technologies available today (FE increase) • DD15 (5% vs previous industry benchmark) • Turbo Compounding • Amplified Common Rail System • Benchmark compression ratio • Thermostat on inlet side • Eaton AMT with integrated shift map for DD15 (up to 20%, depending on driver) • Soft cruise (up to 1%) • Gearing for cruise speed around sweet spot (up to 10%) • APUs to reduce idling (5% depending on idle time) • Short Term Future Technologies • BlueTec – EPA 2010 (3 to 5 % compared to non-SCR engines) • Gear based torque management (under evaluation) • Engine oil temperature thermostat (up to 3% in extremely cold climate) • Long Term Future Technologies • Electrified Exhaust energy recycling • Coolant energy recycling • Variable injection angles • Variable compression ratio
5.46 mpg 2400 9th gear 2000 6.68 mpg 1600 Peak Torque Zone 1200 Engine Speed r/min 10th gear 800 400 Road Speed Limit 0 0 10 20 30 40 50 60 70 80 Vehicle Speed Mile/h Optimize Fuel Consumption – Engine & Engine BasedAuxiliary Loads (cont.) • Driver Influence (depending on baseline driver up to 25%) • Progressive shifting • Moderate accelerations • Fan control • Idling IMPORTANCE OF PROGRESSIVE SHIFTING
Optimize Fuel Consumption – Aerodynamics • Driver influence – high • Speed • Technologies available today (FE gain) • Slow down – 5mph reduction (5% to 8%) • Optimum 5th wheel height and trailer gap (6%) • Aero bumper and air dam (3%) • Tractor side fairings/skirts (3%) • Aero mirrors (1%) • Eliminate sunvisor (1%) • Eliminate hood mounted aux mirrors (1%) • Trailer side skirts and wheel covers (3.3%) • Trailer undercarriage flow device (1%) • Rear trailer aero treatment (2 to 4%) • Technologies of the future (FE gain) • Optimize tractor/trailer interface (5%) • Tractor/Trailer cross flow vortex trap device (3.5%) • Trailer vortex strake device (2%) Power Required toOvercome Aero Drag Note: approximately 50% of aero drag is from the tractor and front of trailer, while the other half is from the trailer undercarriage and rear of trailer.
Optimize Fuel Consumption – Rolling Resistance, Drivetrain • Driver Influence - minimal • Tire inspection/inflation • Technologies available today • Fuel efficient tire vs. std tire (5%) • Wide based singles with tire inflation system (2.5%) • Proper tire inflation vs. 10% under-inflation (1%) • Synthetic transmission and axle lube (1%) • Direct drive vs. overdrive (up to 1%) • Proper axle ratio (up to 10%) • Technologies of the future • Advanced tandems
Optimize Fuel Consumption – Braking • Driver influence – moderate to high • Maintain momentum (braking/accelerating) • Technologies available today • Driving technique – looking ahead to minimize braking/accelerating • Route optimization (traffic, stops, etc) • Hybrid for medium duty (25% to 40%) • Technologies of the future • Hybrid for Class 8 (4 to 5%) • Hybrid • Recovers brake energy • Reduction of idle time (ePTO, HVAC/hotel power, etc) • Lower fuel consumption reduces emissions
Different HEV Configurations Long haul City bus Delivery Refuse Touring coach • Frequent stops • Low mileage, lower share of fuel cost • Operating in emission sensitive city area Urban • Variations due to altitude profile and road grade • High share of fuel cost • Demand for hotel power (HVAC, powernet) Highway Serial Hybrid – Application:City-Bus engine/ generator engine/ generator ICE • Combustion engine (ICE) propels only generator • No mechanical connection between ICE and axles • ICE can be operated always at optimal point battery e.g. Orion VII Parallel Hybrid – Application: Bus, Van, Truck engine/ generator • Electric motor coupled with conventional powertrain • Electric motor is used either for charging the battery or to support the ICE. Can drive ePTO ICE e.g. M2e Business Class battery Dual Hybrid – Application: PassengerCars ICE • A part of the drive torque of the ICE is transferreddirectly into the drive train • The other part is used over a planetary gear for thedrive of a electrical generator planetary axle engine/ generator e.g. Toyota Prius battery
Optimize Fuel Consumption Summary • Class 8 long haul tractor trailer combination: • Aerodynamics (tractor & trailer) improvements: approx. 10 -15 % possible fuel savings with integrated tractor and trailer. • Others improvements: approx. 15- 25% possible fuel savings • Driver remains a critical element • Medium Duty Delivery vehicle: • Hybrids: approx. 25% - 40% possible fuel savings depending on vehicleapplication, most promising in stop and go traffic • Hybrid with ePTO: approx. 50% to 60% fuel savings with idle reduction