Download
1 / 4
40 likes | 225 Vues
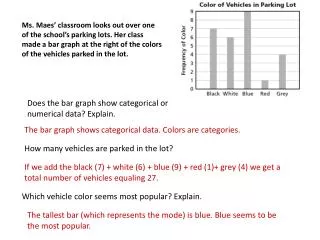
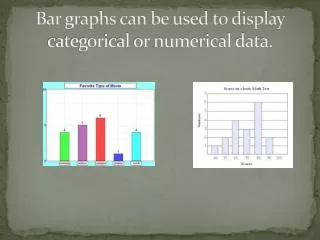
Bar graphs can be used to display categorical or numerical data. Histograms. A histogram is a special type of bar graph used to display numerical data that has been organized into intervals. The heights of the bars show the number of people in each group.

E N D
Bar graphs can be used to display categorical or numerical data.
Histograms • A histogram is a special type of bar graph used to display numerical data that has been organized into intervals. The heights of the bars show the number of people in each group. The horizontal axis represents the intervals. The vertical axis represents the frequency or number of observations
To construct a histogram • 1. Draw and label a horizontal and vertical axis. Use equal intervals Every interval from the lowest value to highest value must be included even if it has a frequency of 0. • 2. Include a title • 3. For each interval, draw a bar whose height is given by the frequencies. There is no space between the bars
Ages of people who entered a store Display the data in a histogram