Introduction to Bar Graphs for Data Visualization
Learn what a bar graph is and how it can help you analyze data effectively. Understand the process of creating a bar graph and interpreting the results to make informed decisions. Explore the importance of utilizing bar graphs in various scenarios for clear comparisons and insights.


Introduction to Bar Graphs for Data Visualization
E N D
Presentation Transcript
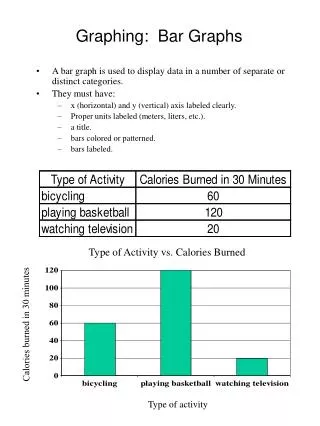
What is a bar graph? • A bar graph is a graphical way of showing comparisons by using rectangular shapes with lengths proportional to the measure of what is being compared.
Example • If an airline company wanted to know what month of the year that more people fly with their company, they could keep records each month and then put these numbers into a bar graph.
Results • By looking at the bar graph that was created with the data collected, we can clearly see that the month that more people fly with this airline is clearly December.
Can you make a bar graph? • You must first have information to put into the bar graph.
How will each breathe you blow into the balloon affect how big around the balloon gets?
Review • How can a bar graph be useful? • Can anyone make a bar graph? • What must you have in order to make a bar graph?
Resources • Students may visit http://nces.ed.gov/ncskidsgraphing