Understanding Bar Graphs: Definition, Advantages, and Disadvantages
A bar graph is a diagram where numerical values are represented by the height or length of equal-width rectangular bars, displayed either vertically or horizontally. It primarily utilizes categorical data—values that can be sorted into groups. Bar graphs facilitate easy comparisons and visualizations of differences in data. However, they may require additional explanation to prevent misinterpretation and can sometimes misrepresent complex datasets. This article discusses the definition, advantages, and disadvantages of bar graphs.


Understanding Bar Graphs: Definition, Advantages, and Disadvantages
E N D
Presentation Transcript
Bar Graphs Caroline Lembck Anne Jacob Hannah Gallagher
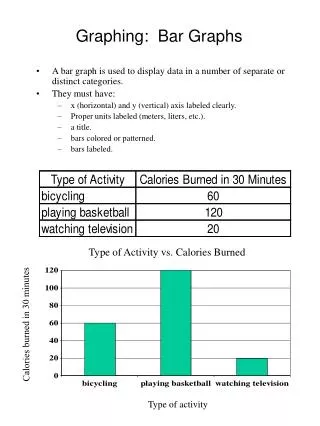
Definition: A bar graph is a diagram in which the numerical values and data are represented by the height or length of lines or rectangles of equal width
Definition continued… The data is displayed using vertical or horizontal rectangular bars.
Data: In a bar graph, only one set of data is necessary to make the graph. That set of data is called categorical data. Categorical data is values that can be sorted into groups or categories. This does not necessarily mean that you cannothave a number as your category. For example, if you have a bar graph representing the different heights of people, even though you are using numbers, it is still considered categorical data because you categorize the data you collect into different groups. http://www.abs.gov.au/websitedbs/CaSHome.nsf/Home/CaSQ+3A+WHAT'S+THE+DIFFERENCE+BETWEEN+NUMERICAL+AND+CATEGORICAL+DATA
Advantage #1 Comparisons are easily made when using a bar graph because the data and information is easy to see. A bar graph helps visualize showing differences and making comparisons. he information is displayed in a way that helps people make generalizations and conclusions very quickly and easily.
Advantage #2 Bar graphs are also very versatile and used in many different situations. There are also many types of bar graphs including broken- bar graphs and multiple bar graphs. These can be used for sets of data that are very small or very large. Multiple bar graphs represent the value of several different items.
Disadvantage #1 Bar graphs might require additional explanation and might not be very accurate. The bar graph can sometimes fail to reveal key assumptions, causes, effects, or patterns.
Disadvantage #2 Bar graphs can be easily manipulated to yield false impressions and not very good for a large number of categories. Especially comparing two or more variables, especially if one is not consistently bigger than the other.
Question • If you pick two students from the class, what is the probability that their birthday is in Spring*? (*Spring is months March, April, and May)
Solve it! • 6/28* 5/27 • 30/756=5/126
Sites Used • www.abs.gov.au/websitedbs/CaSHome.nsf/Home/CaSQ+3A+WHAT'S+THE+DIFFERENCE+BETWEEN+NUMERICAL+AND+CATEGORICAL+DATA • http://www.cdc.gov/nchs/about/50th_anniversary.htm • http://cstl.syr.edu/fipse/tabbar/revbar/revbar.htm