Bar Graphs Histograms
Vocabulary. Frequency Table: a table for organizing a set of data that shows the number of times each item or number appears.Statistics: the branch of mathematics that deals with collecting, organizing and analyzing data.Bar Graph: a graphic form using bars to make comparisons of statistics. Vocab


Bar Graphs Histograms
E N D
Presentation Transcript
1. Bar Graphs & Histograms Glenn C. Jones Middle School
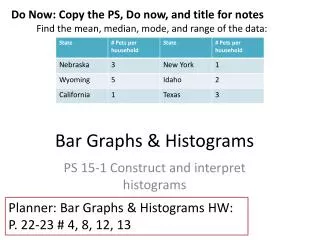
2. Vocabulary Frequency Table: a table for organizing a set of data that shows the number of times each item or number appears.
Statistics: the branch of mathematics that deals with collecting, organizing and analyzing data.
Bar Graph: a graphic form using bars to make comparisons of statistics
3. Vocabulary Histogram: a special kind of bar graph that displays the frequency of data that has been organized into equal intervals. The intervals cover all possible values of data, therefore there are no spaces between the bars on the graph.
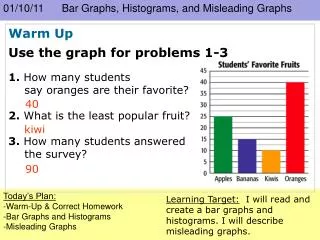
4. Example #1
5. Example #1 Results
6. Construct a Histogram
7. Example #2 Results
8. Make a Frequency Table
9. Example #3 Results