Download
1 / 25
370 likes | 794 Vues
Systems Reliability, Supportability and Availability Analysis. System Reliability Modeling and Analysis r-out-of-n and Standby Configurations. Systems Reliability Models. r-out-of-n Reliability Configuration. System Reliability Models - r-out-of-n Configuration.

E N D
Systems Reliability, Supportability and Availability Analysis System Reliability Modeling and Analysisr-out-of-n and Standby Configurations
Systems Reliability Models r-out-of-n Reliability Configuration
System Reliability Models - r-out-of-n Configuration Definition - a system containing n elements, out of which at least r are required for system success, is the so called r-out-of-n reliability configuration Remark - the r-out-of-n reliability configuration is a general configuration. If r = 1, the configuration is a parallel configuration. If r = n, the configuration is a series onfiguration. Example - a piece of stranded wire, with n strands, which at least r strands are necessary to support the required load
System Reliability Models - r-out-of-n Configuration Reliability block diagram Assumption - the system consists of n identical and independent elements Remark - the number of elements, r, surviving time t, is a random variable with Binomial distribution E1 E2 En r-out-of-n
System Reliability Models - r-out-of-n Configuration Element reliability Ri(t) = R(t) for i = 1, 2, ... ,n System reliability System failure rate System mean time between failures
System Reliability Models - r-out-of-n Configuration Exponential distributions of element time to failure Ti ~ E() for i = 1, 2, ... 5 special case: n = 5 and r = 3 Reliability Block Diagram: E1 E2 E3 E4 E5 3 out of 5
System Reliability Models - r-out-of-n Configuration continued System reliability System failure rate System mean time between failures
System Reliability Models - r-out-of-n Reliability Configuration Element time to failure is exponential with failure rate n = 3 and r = 1 Reliability block diagram: 1 out of 3 E1 E2 E3
System Reliability Models - r-out-of-n Reliability Configuration System reliability System failure rate System mean time between failures
Example The reliability configuration for a system is r-out-of-n, with r = 3 and n = 5. If T has an exponential distribution with parameter , find: a. RS(t) b. hS(t) c. MTBFS
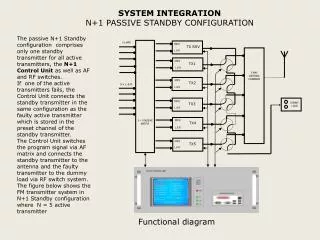
System Reliability Models - Standby Configuration Definition - the standby reliability configuration consists of one or more elements standing by to take over the system operation on occurrence of failure of the operating element Remarks Usually a standby configuration requires failure sensing and switching devices to monitor the operating element and to switch a standby element into operation whenever a failure is sensed The standby elements can be completely de-energized ‘cold standby’ or partially energized ‘warm standby’
E1 M S E2 E3 En System Reliability Models - Standby Configuration Reliability block diagram where E1 is the initial operating element E2, E3, ... En are initial standby elements M is the failure sensing device S is the switching device and
System Reliability Models - Standby Configuration Assumptions: Perfect failure sensing and switching Zero failure rate during standby Two identical and independent elements Element time to failure is exponential with parameter Reliability block diagram System success results if E1 survives time t or if E1 fails at time t1, and E2 survives time t - t1 E1 E2
System Reliability Models - Standby Configuration System reliability RS(t) = (1 + t)e-t System failure rate hS(t) = 2t/(1 + t) System mean time between failures MTTFS = 2
System Reliability Models - Standby Configuration Reliability contribution of the 1st element Reliability contribution of the 2nd element
System Reliability Models - Standby Configuration Considerations: Perfect failure sensing and switching Zero failure rate during standby Independent elements Exponential distributions of element time to failure Ti ~ E(i) for i = 1, 2, ... ,n System mean time between failures
System Reliability Models - Standby Configuration System reliability
System Reliability Models - Standby Configuration If i = , i = 1, 2, ... n, then and
System Reliability Models - Standby Configuration Conclusions As the number of redundant paths increases, the mission reliability approaches the reliability of the monitor/switching device. When the failure rates of the path, the switching devices, and the monitor/switching device are equal, standby redundancy with two paths results in a mission reliability considerably less than that of a single non-redundant path. For systems where the switching device and monitor failure rates are less than the path failure rate, the greatest increase in reliability occurs when one redundant path is added to a single path.
System Reliability Models - Conclusions continued For a given path and switching device failure rate, reliability improvement increases rapidly as the monitor failure rate decreases and the number of redundant paths increases. The same is true if the monitor failure rate is held constant and the switching device failure rate decreases. Significant improvement in mission reliability through redundancy results from the utilization of switching devices and monitors that are much more reliable than the path being switched.
Configuration Considerations in Design Series Configuration - Relative to Redundant Configuration Simpler Increases Basic Reliability Reduces Support Resources Decreases Mission Reliability Redundant Configuration - Relative to Series Configuration More Complex - Increases Weight Requires More Testability Increases Support Resources Decreases Basic Reliability Increases Mission Reliability