Download
1 / 21
210 likes | 230 Vues
Seasonal Evolution Of Dissolved Inorganic Carbon Along A Cross-shelf Transect In The Gulf Of Maine: The Influence Of Riverine Discharge. Joe Salisbury (UNH) Doug Vandemark (UNH) Janet Campbell (UNH) Chris Hunt (UNH) Amala Mahadevan (BU) Bror Johnsson (BU) Wade McGillis (LDEO)

E N D
Seasonal Evolution Of Dissolved Inorganic Carbon Along A Cross-shelf Transect In The Gulf Of Maine: The Influence Of Riverine Discharge. Joe Salisbury (UNH) Doug Vandemark (UNH) Janet Campbell (UNH) Chris Hunt (UNH) Amala Mahadevan (BU) Bror Johnsson (BU) Wade McGillis (LDEO) Huijie Xue (UMO)
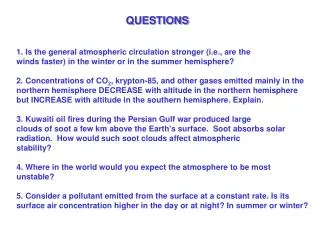
Questions • What are the time and space scales of inorganic carbon distributions in a temperate coastal regime? • Are the temporal dynamics of biologically-mediated DIC different in plume and oceanic provinces? • Ancillary climate change questions---
Outline: • Setting • Data and Methods • Results • Conclusions
- UNH monthly transects (right) Coastal Ocean Observation and Analysis Center (COOA) Gulf of Maine and associated watersheds (left) UNH COOA Transects (right)
The Spring and Summer of 2005 were really wet Mean surface salinity (Apr-July, 04) Mean surface salinity (Apr-July, 05)
Measurements used in this project Measurements of the COOA time series
R/V Gulf Challenger Profilers for IOPs , AOPs, and CTD Infrared CO2 gas analyzer UNH Field Component Fast-rate CO2 equilibrator Flo-thru pCO2, oxygen, IOPs, GTD, and CTD
Methods: Along each cruise track, estimate DIC and biologically-mediated DIC (DICbio) for cruises during 2004 and 2005. Within the domain, estimate volumes of freshwater and oceanic influence. Plot data in space-time grids Estimate spatio-temporal distribution of DICbio, net DICbio accumulation (source/sink term) and temporal derivative of DICbio (related to NEM). - Underlying assumption - day-scale processes can be attributed along isohalines. e.g. For any day, “measured” DICbio is consistent along the entire isohaline.
Estimate of DICbio DIC estimated from “conservative” alkalinity and atmospheric pCO2 DICbio Observed DIC - estimated from measured DIC (or alkalinity) and pCO2
14 m Estimate of plume volume (all water <32psu) a) Estimate of plume area using GOM-POM model b) Estimate of plume depth (interpolated from cruise profiles) 5/19/04 5/21/05 c) depth * area = volume (km3)
Discharge 103 ft3 s-1 Estimated dissolved inorganic carbon (DIC) mol kg-1
DIC mixing anomaly (mol kg-1) due to salinity and temperature - mainly a dilution signal from low DIC river water
Biological DIC anomaly (DICbio mol kg-1)* • note: - Difference between years • Across track variability Temporal derivative related to ecosystem production*
Average DICbio (mol kg-1) in plume and non-plume volumes Plume Non-plume
Average daily net DICbio production (mmol C m2 day-1)* Plume Non-plume * Calculated as (7-day derivative) / 7
Plume Non-plume Total )
Conclusions: In terms bio-mediated CO2, this system is variable in time and space, alternately changing between a local source and sink of atmospheric CO2 on monthly time scales. Over 20 months of observations, our domain was a very small sink of CO2 (-120 mtC, but ranged from -1100 to +1200 mtC over the time series.) The freshwater from the land apparently affects the net surface productivity (different time signatures in plume and non-plume regions) Use caution when making budgets from limited time series. e.g. 2004 a lot different than 2005 Suggestive of sensitivity to minor climate variations.