Distribution Summaries
This comprehensive guide explores the fundamental concepts of central tendency and spread in data distribution, focusing on key metrics such as mean, median, and mode for central tendency, and measures of spread including standard deviation, variance, and interquartile range (IQR). Learn how to interpret these statistics and their significance in analyzing data. Get insights into the range of a distribution, and understand the implications of variance and standard deviation in representing data variability. Ideal for students and professionals alike.

Distribution Summaries
E N D
Presentation Transcript
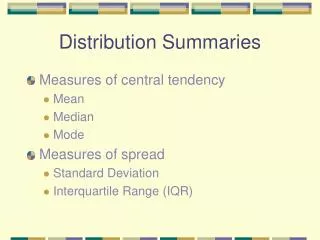
Distribution Summaries • Measures of central tendency • Mean • Median • Mode • Measures of spread • Standard Deviation • Interquartile Range (IQR)
Distribution spread • Range • Standard deviation • Variance
Range • The range of a distribution is the difference between the highest value and the lowest value Length of Cohabitation in Months 0 103
Range (cont.) . sum cohbl Variable | Obs Mean Std. Dev. Min Max ---------+----------------------------------------------------- cohblnth | 626 11.74601 17.1347 0 103
Range (cont.) . sum cohbl, d # Months Cohabited ------------------------------------------------------------- Percentiles Smallest 1% 0 0 5% 0 0 10% 0 0 Obs 626 25% 0 0 Sum of Wgt. 626 50% 5 Mean 11.74601 Largest Std. Dev. 17.1347 75% 17 97 90% 32 97 Variance 293.5978 95% 46 103 Skewness 2.304175 99% 79 103 Kurtosis 9.411293
Range (cont.) 103 97
Range • The range of a distribution is the difference between the highest value and the lowest value
Variance • The most commonly used measure of spread • One of the most fundamental concepts in statistics
Variance Formula • In words, the variance is the mean squared deviation (from the mean) • A deviation is the difference between a score and the mean of all scores • We square this deviation for all observations • We then take the mean of all these
Variance Formula (cont.) Definitional Formula
Variance Formula (cont.) Computational Formula
Variance (example) Obs Square Dev Dev Sq 1 1 -2 4 2 4 -1 1 3 9 0 0 4 16 1 1 5 25 2 4 Sum 15 55 0 10 Mean 3 2 Variance = (55 - 225 / 5) / 5 = (55-45) / 5 = 2
Why sum the SQUARES? • Recall that the sum of the deviations around the mean is zero • Therefore the average deviation is zero • Squaring a positive or negative number always creates a positive result • This way we are assured of a sum that is greater than or equal to zero
Compare (cont.) Squared Deviations Deviations 4 1 0 1 4 10 - 12 = -2 11 - 12 = -1 12 - 12 = 0 13 - 12 = 1 14 - 12 = 2 10 - 12 = -2 11 - 12 = -1 12 - 12 = 0 13 - 12 = 1 14 - 12 = 2 60 60 0 Sum 60 60 0 10 12 12 0 Mean 12 12 0 2 Variance
Standard Deviation • The second most commonly used measure of spread • The square root of the variance • Which brings us back to the original metric or units of measure Variance Standard Deviation
What are units? • Consider age • Units are years • Deviations are years • Squared deviations are years squared • Summing and taking mean leaves squared years • Taking square root yields years again
So we have the sd? • The standard deviation is about 1/6 of the range • For a normal distribution, about 70% of observations are ± 1 σ from the mean. • And, about 90% are ± 2 σ from the mean • And, about 99% are ± 3 σ from the mean
1 2 3 4 5 Variance (example) Variance = 2 Std. Dev. = 1.414 Mean
Variability of the scores • Variability and spread of the scores indicate the second characteristic of a distribution that we need to know. • The first was the mean or central location of the distribution
The mean and variance are independent • Means can change without affecting the variance (or standard deviation) • Standard deviation (or variance) can change without affecting the mean • Two distributions may differ on means or on standard deviations or both (or neither)
What makes scores variable? • Why are some scores high and others low? • Why does the variance change? . tab sex, sum(income1) | Summary of income1 sex | Mean Std. Dev. Freq. ------------+------------------------------------ female | 16.207224 10.82088 263 male | 22.371972 13.304104 289 ------------+------------------------------------ Total | 19.434783 12.557429 552