Understanding Central Tendency and Measures of Spread in Statistical Analysis
This summary explores the fundamental concepts of central tendency, including the mean, median, and mode, as well as measures of spread such as standard deviation and interquartile range (IQR). The mean represents the average of a set of observations, calculated by dividing the sum of all numbers by the count. It is essential to recognize its sensitivity to extreme values. Additionally, we examine how distribution data can be analyzed across different demographics and contexts, such as self-esteem, depression, education, income, and cohabitation, providing a comprehensive overview for better statistical understanding.

Understanding Central Tendency and Measures of Spread in Statistical Analysis
E N D
Presentation Transcript
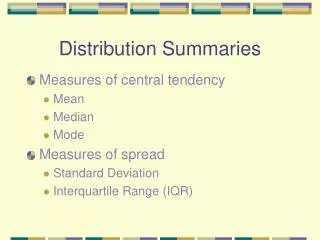
Distribution Summaries • Measures of central tendency • Mean • Median • Mode • Measures of spread • Standard Deviation • Interquartile Range (IQR)
Mean • Mean or Arithmetic Average or Average is what we normally understand as the average of a set of numbers (observations) • Add up all the numbers and divide by the number of numbers (n).
Example • For the observations: 21 25 32 • n = 3 • The sum is 78 • The mean is 78/3 = 26 21 22 23 24 25 26 27 28 29 30 31 32
Consider the formula End Begin Observation Sigma - means add ‘em up! The Mean Sample Size Subscripts Indicating (indexing) Individuals
Characteristics of Mean • Balance point • Sum of deviations is zero • Influenced by extreme scores
Balance Point 21 22 23 24 25 26 27 28 29 30 31 32
Sum of deviations is zero • Deviation is score minus mean 21 - 26 = -5 25 - 26 = -1 32 - 26 = 6 78 78 0
Influenced by Extremes Extreme 20 30 40 50 60 70 80 90 100 100 120 130 Mean 42 Most Cases, Typical Case
Instead of a few cases .4 Distribution of ages N = 626 Fraction .2 0 18 22 26 30 34 38 42 46 M = 25.43
Self-Esteem The mean is not the most common N = 624 M = 33.3
Self-esteem by sex .2 .1 0 10 20 30 40 10 20 30 40 M = 32.9 M = 33.6 Females Males
How about numerically? . tabulate sex, summ(love1) | Summary of Rubin Love Scale sex | Mean Std. Dev. Freq. ------------+------------------------------------ female | 86.153674 10.426731 313 male | 89.00639 8.7537514 313 ------------+------------------------------------ Total | 87.580032 9.7242954 626
Another? (Depression) . tabulate sex, summ(depres1) | Summary of ces-d scale items s112-s123 sex | Mean Std. Dev. Freq. ------------+------------------------------------ female | 13.463899 11.27072 311 male | 11.405751 8.9336186 313 ------------+------------------------------------ Total | 12.431527 10.209712 624
Depression by Education . tabulate ed1, summ(depres1) years of | Summary of ces-d scale items s112-s123 education | Mean Std. Dev. Freq. ------------+------------------------------------ 9 | 41 0 1 11 | 15.76 11.475626 25 12 | 14.608993 11.434858 93 13 | 13.592593 10.478033 27 14 | 13.887233 10.608088 183 15 | 12.14838 8.6328703 87 16 | 9.9244392 8.6261835 154 18 | 11.037037 12.270921 27 20 | 6.3703704 5.2925793 27 ------------+------------------------------------ Total | 12.431527 10.209712 624
Cohabitation by income . tabulate income1, summ( cohblnth) | Summary of # Months Cohabited income1 | Mean Std. Dev. Freq. ------------+------------------------------------ 3.5 | 9 14.455185 43 7.5 | 9.5376344 13.7173 93 12.5 | 13.5 17.588839 114 20 | 12.284768 17.36486 151 30 | 12.722772 18.828765 101 42.5 | 15.135135 23.566881 37 62.5 | 14.916667 15.529786 12 82.5 | 0 0 1 ------------+------------------------------------ Total | 12.123188 17.370189 552
Income by education . tabulate ed1, summ(income1) years of | Summary of income1 education | Mean Std. Dev. Freq. ------------+------------------------------------ 11 | 11.452381 7.6483736 21 12 | 17.055556 11.563953 81 13 | 17.76087 8.5464899 23 14 | 14.876543 9.0504215 162 15 | 18.65 10.46616 80 16 | 24.960145 14.16097 138 18 | 22.204545 15.181959 22 20 | 34.5 12.788341 25 ------------+------------------------------------ Total | 19.434783 12.557429 552
The formula (again) End Begin Observation Sigma - means add ‘em up! The Mean Sample Size Subscripts Indicating (indexing) Individuals