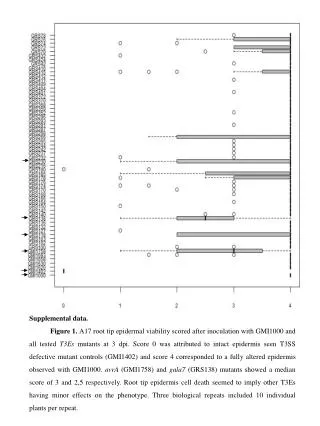
Supplemental Data for:
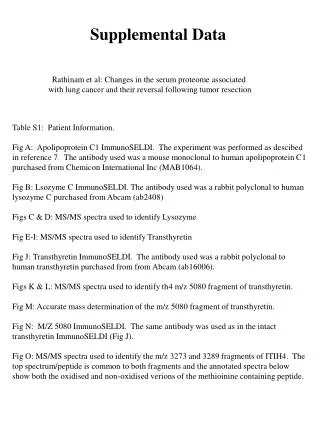
Supplemental Data for: Metabolism of Flumatinib, a Novel Antineoplastic Tyrosine Kinase Inhibitor, in Chronic Myelogenous Leukemia Patients by Aishen Gong, Xiaoyan Chen, Pan Deng and Dafang Zhong Drug Metabolism and Disposition. Figure S1 1 H NMR spectrum of M0.

Supplemental Data for:
E N D
Presentation Transcript
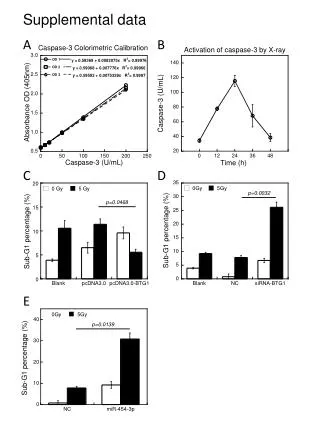
Supplemental Data for: Metabolism of Flumatinib, a Novel Antineoplastic Tyrosine Kinase Inhibitor, in Chronic Myelogenous Leukemia Patients by Aishen Gong, Xiaoyan Chen, Pan Deng and Dafang Zhong Drug Metabolism and Disposition
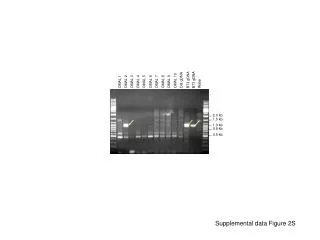
urine_blank 1: TOF MS ES+ 23.05 579.244 0.05Da 100 20.4 % 0 Time 15.00 16.00 17.00 18.00 19.00 20.00 21.00 22.00 23.00 24.00 25.00 urine 1: TOF MS ES+ 16.59, M2-1 579.244 0.05Da 100 1.37e3 20.91, M2-8 22.21, M2-9 % 18.90, M2-5 19.11, M2-6 20.20, M2-7 18.11, M2-4 0 15.00 16.00 17.00 18.00 19.00 20.00 21.00 22.00 23.00 24.00 25.00 urine_TiCl3 1: TOF MS ES+ 20.90, M2-8 579.244 0.05Da 100 901 % 18.87, M-5 18.08, M2-4 20.16, M2-7 0 15.00 16.00 17.00 18.00 19.00 20.00 21.00 22.00 23.00 24.00 25.00 Figure S13 Extracted ion chromatograms of m/z 579.244 in human urine. A, blank urine; B, urine sample unreduced by TiCl3; C, urine sample reduced by TiCl3
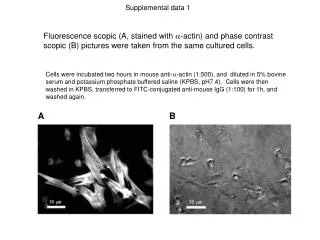
feces 1: TOF MS ES+ 21.93, M2-9 579.244 0.05Da 100 778 17.76, M2-4 % 17.41, M2-3 18.55, M2-5 20.72, M2-8 17.03, M2-2 19.90, M2-7 16.34, M2-1 19.09, M2-6 0 Time 15.00 16.00 17.00 18.00 19.00 20.00 21.00 22.00 23.00 24.00 25.00 feces_TiCl3 1: TOF MS ES+ 17.74, M2-4 579.244 0.05Da 100 461 17.38, M2-3 % 18.50, M2-5 20.67, M2-8 16.96, M2-2 19.88, M2-7 24.51 0 15.00 16.00 17.00 18.00 19.00 20.00 21.00 22.00 23.00 24.00 25.00 Figure S14 Extracted ion chromatograms of m/z 579.244 in human feces. A, feces sample unreduced by TiCl3; B, feces sample reduced by TiCl3.
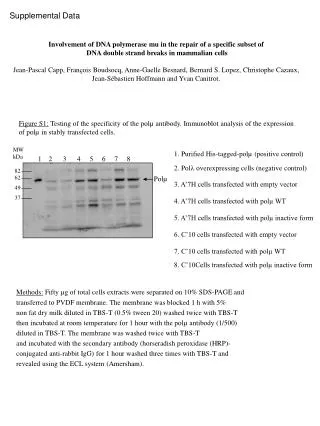
urine_blank 1: TOF MS ES+ 319.13 0.05Da 100 1.31e3 % 0 4.00 6.00 8.00 10.00 12.00 14.00 16.00 18.00 urine 1: TOF MS ES+ 7.64 319.13 0.05Da 100 2.28e4 14.75, M6 14.33 10.02 % 6.76 8.37 8.74 0 Time 4.00 6.00 8.00 10.00 12.00 14.00 16.00 18.00 urine_TiCl3 1: TOF MS ES+ 7.62 319.13 0.05Da 100 2.16e4 10.00 14.33 % 6.87 8.72 0 4.00 6.00 8.00 10.00 12.00 14.00 16.00 18.00 Figure S15 Extracted ion chromatograms of m/z 319.130 in human urine. A, blank urine; B, urine sample unreduced by TiCl3; C, urine sample reduced by TiCl3.