MALDI-TOF/TOF MS Data Supporting Peptide Assignments
Comparative analysis of synthetic peptides and experimental data for accurate peptide sequence assignments using MALDI-TOF/TOF MS. Exploration of ERK1/2 phosphorylation induction by glucose and des-Arg9-BK in mouse proximal tubule cells.

MALDI-TOF/TOF MS Data Supporting Peptide Assignments
E N D
Presentation Transcript
Supplemental Figure 1a-e.Supporting MALDI-TOF/TOF MS information for primary peptide amino acid sequence assignments. In some cases, the accurate assignment of amino acid sequences to MS/MS datasets can be limited. To support the correct peptide assignment for masses listed in Figure 1a-d, synthetic peptides were ordered and reanalyzed by a MALDI-TOF/TOF MS approach. These data for the synthetic peptides have been plotting alongside and in comparison to the fragmentation spectra for the experimentally acquired data supported the peptide assignments made. S1a) MALDI-TOF/TOF MS spectra for des-Phe8-des-Arg9-BK, S1b) MALDI-TOF/TOF MS spectra for des-Arg9-BK, S1c) MALDI-TOF/TOF MS spectra for hydroxyprolyl (Hyp)3-des-Arg9-BK, S1d) MALDI-TOF/TOF MS spectra for ITIH4 peptide. S1e) Lastly, one peptide for which TOF/TOF data were acquired was not successfully assigned a peptide sequence. The experimental TOF/TOF spectrum is provided for full disclosure of research results.
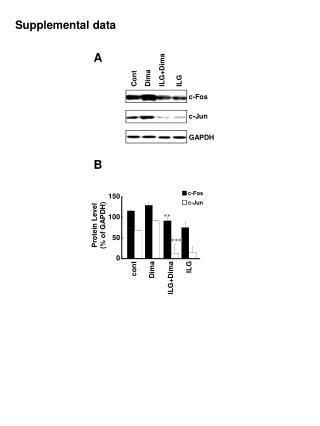
Supplemental Figure 3a. Induction of extracellular-signal-regulated kinases (ERK1/2) phosphorylation by glucose and des-Arg9-BK(1-8) in mouse proximal tubule cells. An immortalized C57 black mouse proximal tubule cell line (compliments of Jeffery Schelling, MD, Case Western Reserve University) was used to determine the effects of 10 minute des-Arg9- BK treatment on Erk1/2 phosphorylation. To address the effects of diabetes on renal proximal tubule cells and prior to treating cells with des-Arg9-BK(1-8), the cells were serum starved and then cultured in medium containing 0.5% FBS plus normal glucose (5mM glucose, NG), osmotic control (5mM glucose + 25mM mannitol, M) or high glucose (30mM glucose, HG). After 24h the cells were treated for 10 min with agonist vehicle (PBS) or agonist (des-Arg9-BK(1-8)). Cell lysates from treated cells were immunoblotted for phospho-Erk1/2 (p-Erk1/2) then stripped and re-probed for total-Erk1/2 (t-Erk1/2). The percentage of Erk1/2 phosphorylation induced by culture or treatment was estimated from band densitometry ratios for (p-Erk1/2) to (t-Erk1/2). To compare the effects of glucose and not osmolality on Erk1/2 phosphorylation, the (p-Erk1/2) to (t-Erk1/2) ratio for all samples was normalized to M alone.
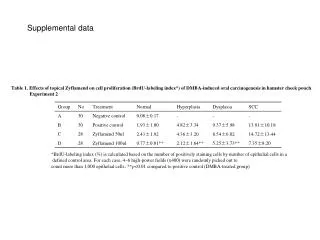
Supplemental Table 1a-e.Supporting MALDI-TOF/TOF MS peak list information for primary peptide amino acid sequence assignments. The complete MALDI-TOF/TOF MS peak list acquired for masses presented in Table 1 are provide to enable alternative interpretation for un-assignment tandem MS data. 1a) acquired peak list data for the 789.394 ion of unassigned identity; 1b) acquired peak list data for the 757.40 ion; 1c) acquired peak list data for the 904.47 ion; 1d) acquired peak list data for the 920.46ion; 1e) acquired peak list data for the 1675.79 ion.