Influence of CLIC4 on α-SMA Expression in Fibroblasts and Tumor Growth Dynamics
50 likes | 157 Vues
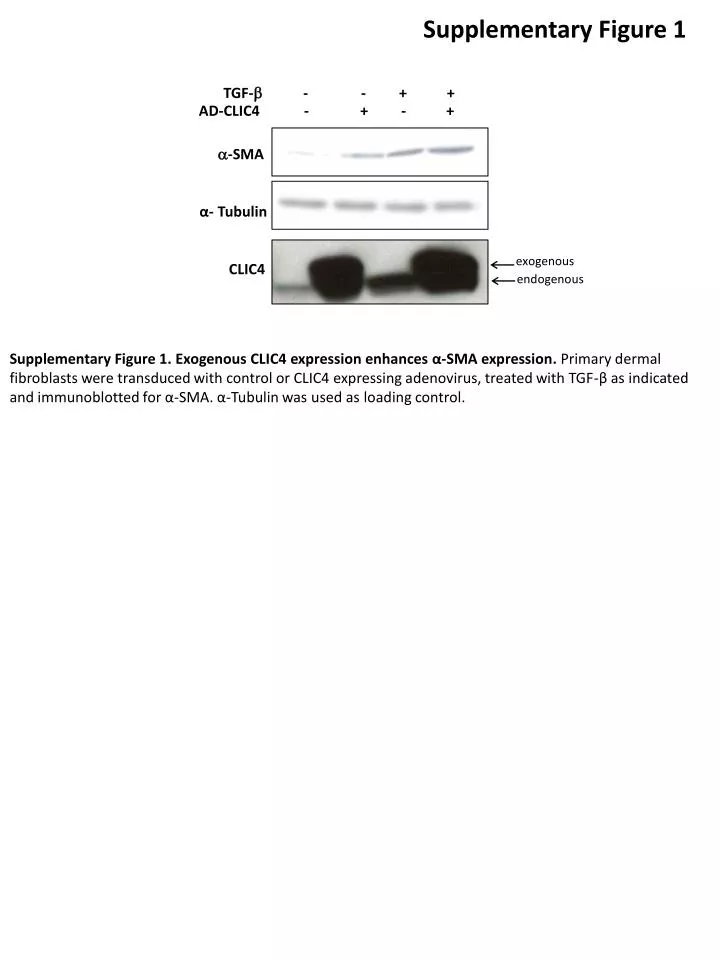
This study investigates the role of CLIC4 in modulating α-SMA expression in primary dermal fibroblasts treated with TGF-β. Immunoblots reveal that exogenous CLIC4 enhances α-SMA expression compared to controls. Additionally, the impact of CLIC4 expression on tumor graft growth in mice is analyzed, showcasing differential effects contingent on the presence of CLIC4 in fibroblasts. Molecular modeling suggests potential interactions between CLIC4 and PPM1a, further elucidating its regulatory mechanisms. This research provides insights into the signaling pathways involved in fibroblast activation and tumor microenvironment.

Influence of CLIC4 on α-SMA Expression in Fibroblasts and Tumor Growth Dynamics
E N D
Presentation Transcript
Supplementary Figure 1 exogenous endogenous -SMA α- Tubulin CLIC4 TGF- - - + + Supplementary Figure 1. Exogenous CLIC4 expression enhances α-SMA expression. Primary dermal fibroblasts were transduced with control or CLIC4 expressing adenovirus, treated with TGF-β as indicated and immunoblotted for α-SMA. α-Tubulin was used as loading control. AD-CLIC4 - + - +
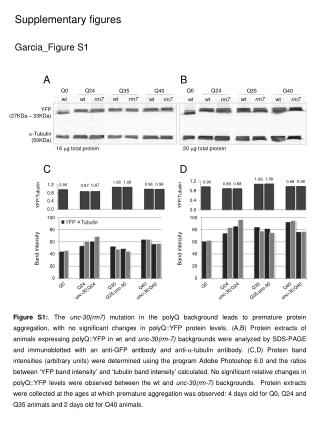
Supplementary Figure 2 a ns Schnurri-2 Fibroblasts Keratinocytes b Supplementary Figure 2. Schnurri-2 transcripts and p-Smad2/3 levels in mouse dermal fibroblasts . (a) cDNA from mouse dermal fibroblasts and epidermal keratinocytes were analyzed for Schnurri-2 expression by real time PCR and normalized to their respective GAPDH levels. Keratinocyte Schnurri-2 levels were statistically compared to fibroblast levels. ns= non significant. (b) Wild-type (WT) or CLIC4 fl/fl fibroblasts transduced with adenoviral Cre recombinase (KO) were treated with TGF-β (5ng/ml; 1h) and lysates were immunoprecipitated with PPM1a antibody and immunoblotted for p-Smad2, p-Smad3 and PPM1a. Non-immunoprecipitated (input) lysates were immunoblotted for p-Smad2, p-Smad3 and CLIC4. After densitometric analysis, immunoprecipitated levels of p-Smad2 and p-Smad3 were normalized to respective levels of input p-Smad2 and p-Smad3. These values are indicated on the figure. Samples undergoing the immunoprecipitation process without any protein lysate (no lysate) or without antibody (no Ab) were used as controls.
Supplementary Figure 3 Acta2 (αSMA) ns * ** Relative expression Supplementary Figure 3. p38α is the major p38 isoform contributing to TGF-β dependent induction of α-SMA expression. p38α, β or δ was knocked down in primary fibroblasts using isoform specific siRNAs. α-SMA expression was examined by real time PCR after treatment with TGF-β as indicated. Statistical comparisons were made as indicated by lines. p-values: ** p<0.005, *p<0.05; ns: non significant
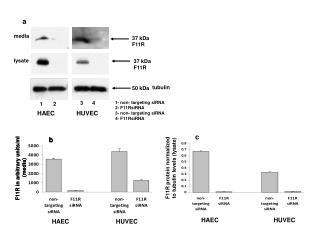
a Supplementary Figure 4 b WT CLIC4 KO CLIC4 KO (after shaving transplant recipient site) WT CLIC4 TR Dox - + - + CLIC4 KO WT β-actin 50μm 50μm Supplementary Figure 4. Status of CLIC4 expression in tumor stroma determines growth of tumor grafts. (a) Left, Transgenic mice expressing CLIC4 (CLIC4 TR) under the control of tetracyclin repressor were generated. Dermal fibroblasts from wild-type (WT)or CLIC4 TR mice were infected with TetR virus ,selected using G418 for 5 days, mixed with human squamous carcinoma cell line SCC13 at 1:1 ratio and injected subcutaneously on the backs of nude mice (n=15). Grafted tumors were allowed to grow for 3 weeks, and then both CLIC4 TR and WT groups were fed doxycycline (200ug/g w/w) (Dox) containing diet which induces CLIC4 expression in CLIC4 TR group. Right, CLIC4 expression in WT and CLIC4 TR cultured fibroblasts infected as above following doxycycline induction. The size of tumor grafts on mice was measured weekly for 9 weeks and plotted as mean +/- SEM. Sizes of tumors in CLIC4 TR group were compared to WT at each week for statistical analysis. *p<0.05, **p<0.005. (b) Top,Primary WT keratinocytes were transduced with oncogenic ras for 5 days, mixed with primary dermal fibroblasts from either WT or CLIC4 KO mice and transplanted to the interscapular region of syngeneic WT or CLIC4 KO mice respectively. Tumor growth was monitored over time. Mice were photographed at termination of study. Tumor free CLIC4 KO mice were shaved in the transplant site to determine presence of any grossly invisible lesions but none were found. Bottom, H&E micrographs of tumor orthografts on all WT mice (5/5) and the single CLIC4 KO tumor bearing mouse 1/5.
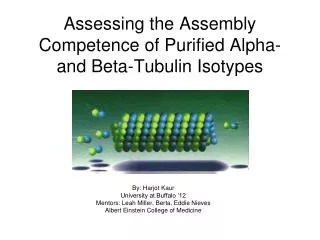
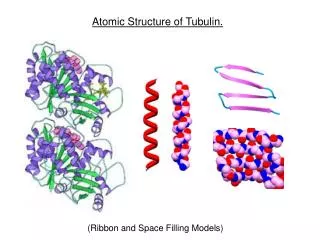
Supplementary Figure 5 Supplementary Figure 5. Molecular modeling predicts that CLIC4 may bind PPM1a. (Top) Structural model of predicted interaction of CLIC4 (pink) with the catalytic site of PPM1a (blue). (Bottom) Structural model of CLIC4 phosphorylation sites predicted by sequence analysis. Blue sticks and blue rings represent predicted serine and tyrosine phosphorylation sites respectively. α-helices (cyan ribbon) and β-strands (pink) that constitute CLIC4 are depicted.