Contingency Table Analysis
Contingency Table Analysis. Mary Whiteside, Ph.D. Overview. Hypotheses of equal proportions Hypotheses of independence Exact distributions and Fisher’s test The Chi squared approximation Median test Measures of dependence The Chi squared goodness-of-fit test Cochran’s test.


Contingency Table Analysis
E N D
Presentation Transcript
Contingency Table Analysis Mary Whiteside, Ph.D.
Overview • Hypotheses of equal proportions • Hypotheses of independence • Exact distributions and Fisher’s test • The Chi squared approximation • Median test • Measures of dependence • The Chi squared goodness-of-fit test • Cochran’s test
Contingency Table Examples • Countries - religion by government • States – dominant political party by geographic region • Mutual funds - style by family • Companies - industry by location of headquarters
More examples - • Countries - government by GDP categories • States - divorce laws by divorce rate categories • Mutual funds - family by Morning Star rankings • Companies - industry by price earnings ratio category
Statistical Inference hypothesis of equal proportions H0: all probabilities (estimated by proportions, relative frequencies) in the same column are equal, H1:at least two of the probabilities in the same column are not equal Here, for an r x c contingency table, r populations are sampled with fixed row totals, n1, n2, … nr.
Hypothesis of independence H0: no association i.e. row and column variable are independent, H1: an association, i.e. row and column variable are not independent Here, one populations is sampled with sample size N. Row totals are random variables.
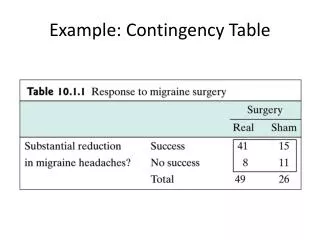
Exact distribution for 2 x 2 tables: hypothesis of equal proportions; n1 = n2 = 2
Fisher’s Exact Test • For 2 x 2 tables assuming fixed row and column totals r, N-r, c, N-c: • Test statistic = x, the frequency of cell11 • Probability = hyper-geometric probability of x successes in a sample of size r from a population of size N with c successes
Large sample approximation for either test • Chi squared = S [Observed - Expected]2 /Expected • Observed frequency for cell ij comes from cross-tabulation of data • Expected frequency for cell ij =Probability Cell ij * N • Degrees of freedom (r-1)*(c-1)
Computing Cell Probabilities Assumes independence or equal probabilities (the null hypothesis) • Probability Cell ij = Probability Row i * Probability Column j = (R i/N) * (C j/N) • Expected frequency ij = (R/N)*(C/N)*N = R*C/N.
Distribution of the Sum • Chi Square with (r-1)*(c-1) degrees of freedom • Assumes [Observed - Expected]2 /Expected is standard normal squared
Implies [Observed - Expected] /Square root[Expected] is standard normal • Implies • = s2 and Observed is a Poisson RV • Poisson is approximately normal if m> 5, traditional guideline • Conover’s relaxed guideline page 201
Measures of Strength: Categorical Variables • Phi 2x2 • Cramer's V for rxc • Pearson's Contingency Coefficient • Tschuprow's T
Measures of Strength: Ordinal Variables • Lambda A .. Rows dependent • Lambda B .. Columns dependent • Symmetric Lambda • Kendall's tau-B • Kendall's tau-C • Gamma
Steps of Statistical Analysis Significance - Strength 1- Test for significance of the observed association 2 -If significant, measure the strength of the association
Consider the correlation coefficient a measure of association (linear relationship between two quantitative variables) • significant but not strong • significant and strong • not significant but “strong” • not significant and not strong
r and Prob (p-value) • r = .20 p-value < .05 • r = .90 p-value < .05 • r = .90 p-value > .05 • r = .20 p-value > .05
Concepts • Predictive associations must be both significant and strong • In a particular application, an association may be important even if it is not predictive (I.e. strong)
More concepts • Highly significant , weak associations result from large samples • Insignificant “strong” associations result from small samples - they may prove to be either predictive or weak with larger samples
Examples • Heart attack Outcomes by Anticoagulant Treatment • Admission Decisions by Gender
Summary • Is there an association? • Investigate with Chi square p-value • If so, how strong is it? • Select the appropriate measure of strength of association • Where does it occur? • Examine cell contributions