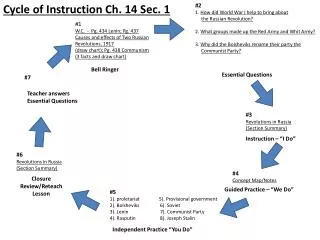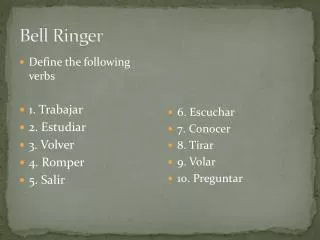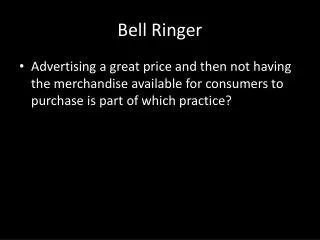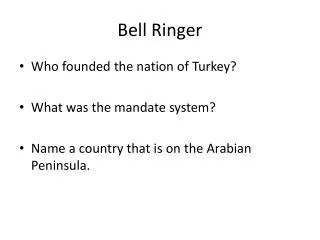
Bell Ringer
Bell Ringer. Get out your notebook and prepare to take notes on Chapter 12 What do the words “frequency,” “data,” and “survey” mean in mathematics ?. Chapter 12. Data Analysis and Probability. 12.1 – Frequency Tables, Line Plots, and Histograms. Essential Question:

Bell Ringer
E N D
Presentation Transcript
Bell Ringer • Get out your notebook and prepare to take notes on Chapter 12 • What do the words “frequency,” “data,” and “survey” mean in mathematics?
Chapter 12 Data Analysis and Probability
12.1 – Frequency Tables, Line Plots, and Histograms • Essential Question: • How do we display data in frequency tables, line plots, and histograms?
12.1 cont. • Choose an integer from 0-9 • Which number was chosen most frequently?
12.1cont. • Frequency • Number of times a data item occurs • Frequency Table • Lists each data item with the number of times it occurs
12.1cont. • Line Plot • Displays data with X marks above each data value on a number line
12.1 cont. • Histogram • Special type of bar graph with no spaces between bars • Height of bar shows the frequency • Intervals are of equal size and do not overlap
12.1 - Closure • How do we display data in frequency tables, line plots, and histograms? • Frequency Table • Draw table • Tally frequency of data • Add tally marks to create frequency column • Line Plot • Draw number line • Write data values on number line • Draw X marks above each number to represent frequency • Histogram • Decide interval size from frequency table • Draw graph (include axes labels and title) • Draw bars onto graph (no spaces between bars)
12.1 - Homework P 638-639; 2-22 even
Bell Ringer • Get out your 12.1 homework assignment • Get out your notebook and prepare to take notes on 12.2 • What is the median of the following set of data?
12.2 – Box-and-Whisker Plots • Essential Question: • How do we make a box-and-whisker plot?
12.2 cont. • Box-and-Whisker Plot: • Graph that summarizes a data set along a number line • Quartiles: • Divide data into four equally-sized groups • Lower Quartile – median of the lower half of the data • Middle Quartile – median of the entire data set • Upper Quartile – median of the upper half of the data
12.2 cont. • Example 1: • Write a statement that compares the data in the following box-and-whisker plots:
12.2 cont. • Example 2: • Write a statement that compares the data in the following box-and-whisker plots: The range for the girls’ heights is greater than the boys’. Overall, the boys tend to be taller than the girls. The girls’ upper quartile is equal to the boys’ lower quartile.
12.2 cont. • Example 3: • Make a box-and-whisker plot for the following data:
12.2 cont. • Steps: • Arrange the data from least to greatest • Find the median • Find the upper and lower quartile values • Draw a number line • Mark the median, least and greatest values, and the quartiles • Draw a box with the quartiles as ends • Mark the median with a vertical line • Draw whiskers from the box to the least and greatest values
12.2 cont. • Example 3 (cont.):
12.2 - Closure • How do we make a box-and-whisker plot? • Use the 8 steps copied into your notebook!!
12.2 - Homework P 644-645; 1-10, 14-16