Download
1 / 56
560 likes | 565 Vues
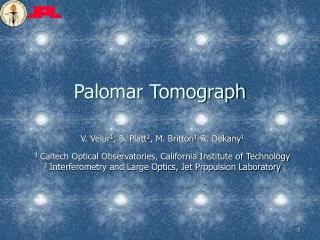
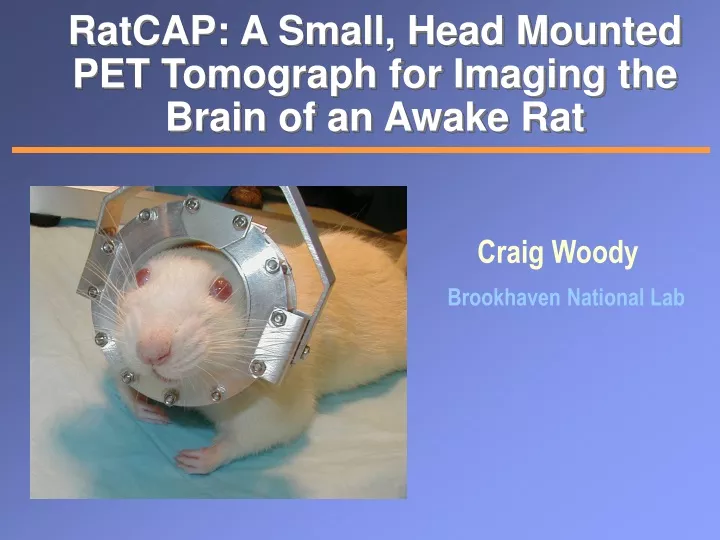
RatCAP: A Small, Head Mounted PET Tomograph for Imaging the Brain of an Awake Rat. Craig Woody Brookhaven National Lab. The Collaboration. BNL. Part of a larger project for Imaging The Awake Animal also involving motion tracking in both PET and MRI. The People. BNL

E N D
RatCAP: A Small, Head Mounted PET Tomograph for Imaging the Brain of an Awake Rat Craig Woody Brookhaven National Lab
The Collaboration BNL Part of a larger project for Imaging The Awake Animal also involving motion tracking in both PET and MRI C.Woody, RatCAP, 6/20/04
The People BNL Physics: C. Woody, S. Stoll, M. Purschke, W.Lenz, M. Lenz, S.Boose Chemistry: D. Schlyer, A. Villanueva, J. Fowler Medical: P. Vaska, N. Volkow*(now at NIH) Instrumentation: P. O’Connor, V. Radeka, J.-F. Pratte*, S. Junnakar, G. DeGeronimo, B.Yu, A.Kandasamy, K.Wolniewicz , S. Rescia Stony Brook S. Shokouhi, A. Kriplani, S.Krishnamoorthy, S.Southekal(BME students) I. Rampil, C.Page, A.Bell (Dept. of Anesthesiology) Sherbrooke* R.Lecomte, R.Fontaine, S. Robert C.Woody, RatCAP, 6/20/04
Positron Emission Tomography e+ e- Radioisotope Isotopes emit positrons with energies of a few hundred keV e+ range ~ few mm g g PET detects coincident 511 keV gamma rays PET Scanner C.Woody, RatCAP, 6/20/04
Positron Emitting Radiotracers Organic molecules are labeled with positron emitting isotopes and used as tracers Tracers can be used to study neurotransmitter activity in the brain C.Woody, RatCAP, 6/20/04
The Problem One wants to use PET to study the neurophysiological activity and behavior in laboratory animals in order to understand and treat these effects in humans. However, animals currently need to be anesthetized during PET imaging. • Anesthesia can greatly depress brain functions and • affect the neurochemistry that one is trying to study • Cannot study animal behavior while under anesthesia C.Woody, RatCAP, 6/20/04
Neurotransmitter Activity in the Brain MAO A DA DA 11C-Cocaine DA DA DA DA DA DA DA DA DA DA DA DA DA DA DA DA DA DA signal Drugs like cocaine can block the re-uptake sites for neurotransmitters like dopamine which upsets the normal equilibrium and can cause effects of addiction C.Woody, RatCAP, 6/20/04
Dopamine Studies using PET T Y R O S I N E T Y R O S I N E D O P A D O P A D A D A M A O M A O D A D A D O P A C D A D O P A C D A D A D A H D A D A m e t h y l p h e n i d a t e D A C O N H C H 2 N D A C H D A 2 5 1 1 H O O C H 3 H D A R D A D A R R D A C O N H C H 2 N R R R C l C l C H 2 5 1 1 H O 1 1 O C H 3 [ C ] r a c l o p r i d e C l C l 1 1 [ C ] r a c l o p r i d e J.Fowler (BNL) C.Woody, RatCAP, 6/20/04
Effects of Anesthesia on the Brain • Blood flow and metabolism depend on type and • dose of anesthetic • How is global vs regional cerebral blood flow (CBF) • modulated by anesthetics • Cerebrovascular reactivity to CO2 is perturbed • Suppression of neural activity • Effects are different for different animals and species M.Pomper, Johns Hopkins C.Woody, RatCAP, 6/20/04
Effects of Anesthesia in Primates From the 9th International Conference: Peace Through Mind/Brain Science, Hamamatsu, Japan, Jan. 30-31, 2002 T.Hershey et.al., Exp. Neurol 2000; 166:342 The effect of anesthesia on the uptake of β-CFT on dopamine transporters in the monkey brain. Response of regional CBF to levodopa in baboons C.Woody, RatCAP, 6/20/04
Effects of Anesthesia in Humans D.B. Stout et al, UCLA 1998 Reduction in glucose metabolism with isoflurane Anesthetic and dosage effect on regional CBF K.Kaisti, Anesthesiology 2002; 96:1358 C.Woody, RatCAP, 6/20/04
RatCAP: RatConcious Animal PET Harderian gland (at eye position) microPET images A septa-less, full-ring tomograph with a diameter of 4 cm and an axial extent of 2 cm, suspended by a tether, which will allow nearly free movement of the awake animal Mockup of the portable ring on the head of a rat RatCAP mounting position superimposed on Concorde R4 MicroPET image of a rat brain C.Woody, RatCAP, 6/20/04
Design Requirements • The tomograph ring must be light enough to be supported by the rat and allow reasonable freedom of movement • Light weight detectors (~ 150 g total weight) • Light weight electronics with low power dissipation New custom ASIC • High data rates and large singles background • Small field of view and large parallax effects • Limited sampling due to space and weight requirements • Must be rugged enough withstand activity of the rat C.Woody, RatCAP, 6/20/04
Freedom of Movement “Ratturn Bowl” Tether support system allows reasonable freedom of movement Similar support structures are used in microdialysis experiments C.Woody, RatCAP, 6/20/04
RatCAP Support System Weight is completely counterbalanced (animal only feels inertia) Gimbal ring allows head movement C.Woody, RatCAP, 6/20/04
Tests with the Mockup on Live Animals Support ring attached to head using only bone cement Inner support ring Complete ring assembly Rat is able to move freely about with entire ring assembly mounted to head C.Woody, RatCAP, 6/20/04
Tomograph Ring Ring containing 12 block detectors of 2x2 mm2 x 5 mm deep LSO crystals with APDs and integrated readout electronics LSO Readout chip APD Socket LSO APD C.Woody, RatCAP, 6/20/04
Sensitivity Comparison of sensitivity with other small animal PET scanners BNL RatCAP 4 cm Ø x 2 cm ~ 150 cps/mCi (0.41%) UCLA mPET 17 cm Ø x 2 cm • Intrinsic detector sensitivities are • essentially the same • Coincidence sensitivities are • proportional to axial acceptance Concord mPET R4 15 cm Ø x 8 cm (1.86%) C.Woody, RatCAP, 6/20/04
Parallax Effects 2 cm Due to the small diameter of the ring, the parallax error is a major factor in determining the spatial resolution C.Woody, RatCAP, 6/20/04
Spatial Resolution and Field of View SimSet Simulation Resolution at the edge of the rat brain Single layer - 10 mm ~ 2.5 mm Double layer - 5 mm ~ 2.0 mm First prototype will be a single layer of 5 mm crystals Will sacrifice sensitivity for improved spatial resolution C.Woody, RatCAP, 6/20/04
LSO Crystal Arrays Proteus unbonded 3M reflector Proteus single crystals CTI white powder reflector Studying different types of crystal arrays to optimize light output and energy resolution C.Woody, RatCAP, 6/20/04
Optimization of Light Collection Dashed = Measured Solid = Opticad OPTICAD wrapped cookie wrapped air unwrapped cookie Ray Tracing Program unwrapped air 2x2 mm2 single crystals wrapped in 3M reflector and coupled with a silicone cookie to a calibrated PMT Npe/MeV = Ng/MeV x e x QE 2400 = 25,000 x 0.4 x 0.24 C.Woody, RatCAP, 6/20/04
Comparison of Light Output and Energy Resolution of Different Crystals Prototype LSO arrays measured with Hamamatsu 4x8 APD Conclusion: Crystals wrapped with 3M reflector and air gap give the highest light output and best energy resolution C.Woody, RatCAP, 6/20/04
Production of Crystal Arrays Arrays were produced by Proteus, Inc (Chagrin Falls, OH) Cutting, polishing and assembly process All final crystal arrays have been received and tested Average light yield ~ 5400 p.e./MeV (~ 22% higher than prototype) C.Woody, RatCAP, 6/20/04
Measurement of Light Output and Energy Resolution of Crystals Arrays s ~ 13% Total spread ~ ± 40% Spread within a crystal array ~ ± 10% Energy resolution ~ 18% for 511 keV g’s (measured with 3rd prototype ASIC) C.Woody, RatCAP, 6/20/04
Characterization of Avalanche Photodiodes All final APD arrays have been received and tested Npe ~ 2700 Typical Gain ~ 50 ~ 135K signal e’s Common voltage for each 16 channels Dark current < 40 nA (~ 1.2 nA/ch) Expected noise in final ASIC ~ 1100 e’s (CT~ 10 pF) Hamamatsu S8550 4x8 array 1.6 x 1.6 mm2 active pixel area C.Woody, RatCAP, 6/20/04
APD Gain and Quantum Efficiency Variation Measured with N2 laser + optical fiber Channel to channel differences dominated by quantum efficiency variation Gain + Quantum Efficiency variation Total spread ~ ± 20 % C.Woody, RatCAP, 6/20/04
Electronics & Readout System Data collection module Control Module • Tomograph ring with detectors and front end readout electronics are mounted to the head of the rat • Tether carries signals, high and low voltage power to a Control Module • CM communicates with a VME based Data Collection Module that adds time stamp information and reads out the data C.Woody, RatCAP, 6/20/04
Provides primary communication with tomograph ring Receives singles data in list mode Adds time stamp Can do coincidence processing Provides serial communication for downloading DAC values for setting thresholds VME Module FPGA C.Woody, RatCAP, 6/20/04
Used to mount crystals, APDs and readout electronincs Contains individual data transfer line for each block Distributes high voltage for APDs, low voltage for ASICs, serial lines for setting DACs Flexible Readout Circuit Control card contains drivers to communicate with VME module C.Woody, RatCAP, 6/20/04
Custom Front End Readout Chip J.-F. Pratte Custom ASIC in 0.18 μm CMOS 4 mW per channel 32 channels 125 mW per chip ~ 1.5 W total on ring Prototype 3 Final size: 4.2 x 1.7 mm C.Woody, RatCAP, 6/20/04
Custom Front End Readout Chip CSP gain 3.3 mV/fC Overall gain 15 mV/fC Preamp/Shaper/ZCD • Discriminator pulse is encoded • to give 5 bit address • Leading edge of encoded serial • pulse train gives time information • 100 MHz clock • Maximum 100 KHz/block • 0.7% deadtime Digital Output (P.O’Connor) C.Woody, RatCAP, 6/20/04
ASIC Performance Slope = 15.2 mV/fC ENC = 902 29 e’s rms FWHM = 18% Linearity Energy Resolution Peaking Time Measurements C.Woody, RatCAP, 6/20/04
ASIC Performance ENC electrons (RMS) Noise Timing (ZCD) Noise is dominated by photostatistics contribution Expect ~ 2.4 ns rms total ENCmin= 1117 @ 100 ns Cintot = 20 pF C.Woody, RatCAP, 6/20/04
ASIC Performance - Timing Resolution 3.54 ns FWHM 6.7 ns FWHM (2.4 ns rms) LSO+APD vs BaF2+PMT Preamp/Shaper + ZCD Electronic Timing Resolution at 511 keV equivalent energy Coupled to LSO/APD with 511 keV g’s timed against a BaF2 scintillator w/PMT Same with CFD C.Woody, RatCAP, 6/20/04
RotatableStage for Obtaining Partial Tomographic Data Source phantoms mounted on rotatable stage to simulate full tomographic ring C.Woody, RatCAP, 6/20/04
Point Source Resolution Intrinsic spatial resolution measured with 22Na point source (< 1 mm dia) FWHM = 2.1 mm Average peak FWHM = 1.28 mm Concorde P4 MicroPET = 1.75 mm UCLA MicroPET = 1.58 mm image intensity (arb) 4 2 0 0 2 4 6 profile axis (mm) 1 mm dia 68Ge point source at R=1.6 mm in rotation stage C.Woody, RatCAP, 6/20/04
Source Images 2 mm 4 mm 4 mm Single 1 mm dia. 68Ge point source 1.6 mm off axis Multiple 68Ge point sources (~ 2mm) spaced ~ 4 mm C.Woody, RatCAP, 6/20/04
Image Reconstruction y P(q,r) r q x LOR q r + Source Sinogram of all projections • Each crystal pair defines a line of response • Lines of response give projections • Each line of response is specified by (r,q) • Data are binned into sinograms which • serve as the input for image reconstruction C.Woody, RatCAP, 6/20/04
Modeled Reconstructed Images Monte Carlo simulations using SimSet Reconstruction using Filtered Back Projection w/ramp filter Fully sampled image of four phantom sources Image reconstructed using incomplete data set Image reconstructed using incomplete data set with interpolation Test Phantom S.Shokouhi C.Woody, RatCAP, 6/20/04
Iterative Image Reconstruction Real data Shepp & Vardi, IEEE Trans. Med. Imaging (1982) 113-122 Maximum Likelihood Expectation Maximization (MLEM method) Forward projection of Monte Carlo data Uniform distribution used to generate SM First guess for real image reconstruction Sinogram data System Matrix Image voxels y = A x x is a vector of all image voxels y is a vector of all projection elements corresponding to x A is the System Matrix which converts the image voxel data to its projections Aij is just the probability that a decay in image voxel xj produces a count in projection yi System Matrix can include many physics effects in the detector and object • Scatter • Attenuation • Positron range • Noise • Detector geometry • Detector efficiency C.Woody, RatCAP, 6/20/04
Ratcap Reconstruction using MLEM Unique features of the RatCAP: Detector Geometry using SimSET • Small but nearly completely filled field of view • Large parallax error (no DOI information) • Finite pixel size (2x2 mm2) at small radius • Incomplete azimuthal sampling Univ. of Washington PET Simulation software • Sinograms • Full 3D sinograms (one sinogram per crystal pair) • 48 crystals/ring x 8 rings • 47 R bins x 24 f bins (interleaved) x 15 segments • System Matrix • 921x15x72192 = 109 elements (but very sparse) • 2GB uncompressed data • Generate ~ 107 photons per 1 mm3 voxel Will move to more detailed simulation using GATE (new PET simulation software based on GEANT4) C.Woody, RatCAP, 6/20/04
First results from MLEM applied to RatCAP Next step... Derenzo Phantom Need to study reconstruction of more complicated objects Tradeoff of resolution vs noise Point source reconstruction Single 1 mm3 voxel C.Woody, RatCAP, 6/20/04
Other Applications Non-Invasive Wrist Monitor • A wide range of quantitative PET studies using tracer • kinetic modeling demand accurately measured • radiotracer concentration in arterial blood as a function • of time after injection (Arterial Input Function). • The common method of measuring the input function is • the invasive withdrawal of blood from a wrist artery. • However, because of its health risks for both patients and • hospital personnel, it is not compatible with clinical studies. • A small ring tomograph similar to the RatCAP can be • used to image the artery and measure the input function C.Woody, RatCAP, 6/20/04
Wrist Monitor for Measuring the Arterial Input Function For human studies, the input function is taken from the radial artery in the wrist. Activity in the surrounding veins produce a significant background which can be rejected using the good spatial resolution of the wrist monitor. Planar image of a 1 mm diameter 68Ge line source Wrist Phantom A.Villaneuva C.Woody, RatCAP, 6/20/04
Simulated Input Function Measurement w/scatter w/o scatter Measure activity as an aqueous solution of a 11C - labeled radioisotope passes between two block detectors Expected input function resolution using Wrist Monitor C.Woody, RatCAP, 6/20/04
Beta Scintillation Microprobe • Radioisotopes used in PET emit positrons with energies • of a few hundred keV which have a range of several mm • in blood or tissue. This range is comparable to the spatial • resolution obtained in most PET cameras. • These positrons can be detected directly using plastic or • crystal scintillators. With crystal scintillators which have • high density, the positrons will range out, depositing all of • their energy in the crystal and producing a large signal. • Small scintillation probes can be used to directly measure • the radiotracer concentration in the blood or tissue. C.L.Woody et.al., IEEE Trans. Nucl. Sci NS-49 (2002) 2208-2212. C.Woody, RatCAP, 6/20/04
Comparison of LSO vs Plastic Scintillator Range and energy loss of positrons in LSO and plastic scintillator Response of LSO and plastic scintillation probes to betas (32P) and gamma rays (137Cs). C.Woody, RatCAP, 6/20/04
Sensitivity and Position Resolution Material LSO LSO Plastic Size 0.3 x 0.5 mm 0.5 x 1.5 mm 1.0x1.0 mm Volume 0.035 mm3 0.295 mm3 0.795 mm3 Sensitivity 10.1 20.7 51.2 (Hz/mCi/cc) Region of sensitivity around the probe can be selected by adjusting the readout threshold to improve spatial resolution C.Woody, RatCAP, 6/20/04
Probe Construction LSO microprobe consisting of 0.5 mm diameter x 1.5 mm long LSO crystal wrapped with several layers of white reflecting teflon and covered with polyester shrink tubing. C.Woody, RatCAP, 6/20/04