Atomic Force Microscopy
Atomic Force Microscopy. Adam Manganiello. Department of Physics, Bridgewater State University , Bridgewater MA, 02324. Mentor: Dr. Deveney. Abstract:

Atomic Force Microscopy
E N D
Presentation Transcript
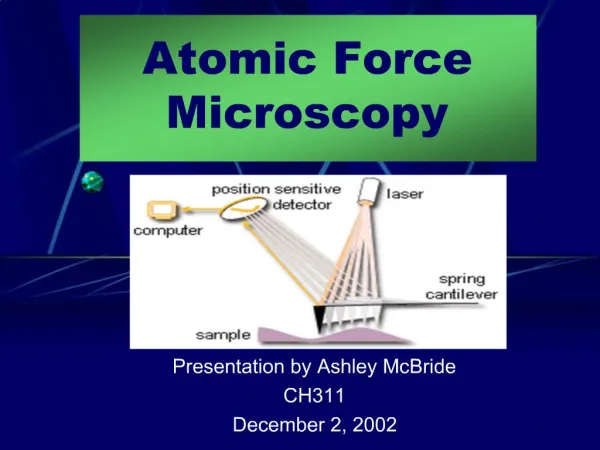
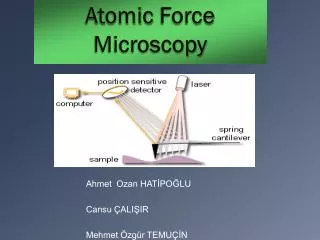
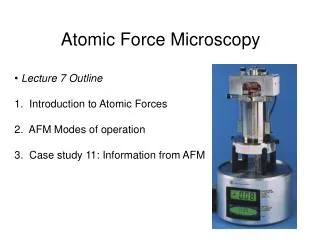
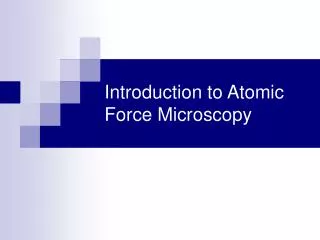
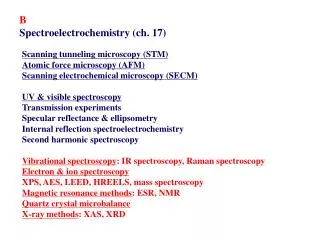
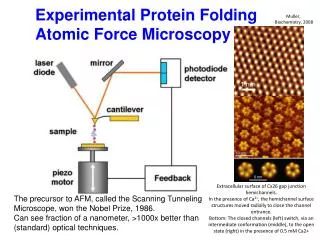
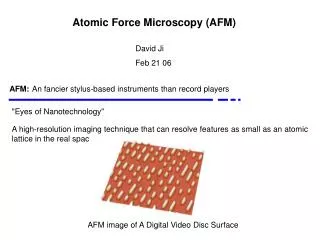
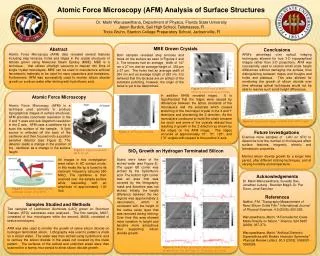
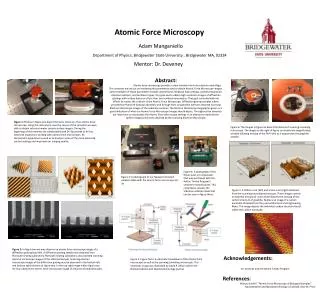
Atomic Force Microscopy Adam Manganiello Department of Physics, Bridgewater State University , Bridgewater MA, 02324 Mentor: Dr. Deveney Abstract: Atomic force microscopy provides a clear window into true substrate metrology. This semester we set out on mastering the parameters used to obtain Atomic Force Microscope images. Some examples of those parameters include contact force, feedback loop settings, sample preparation, vibration isolation, and cantilever types. Our goal was to obtain high resolution images of diffraction gratings with surface features of less than two hundred nanometers. That goal coincided with our efforts to master the controls of the Atomic Force Microscope. Diffraction grating samples where provided by Plymouth Grating Laboratory and through their cooperation we have obtained Scanning Electron Microscope images of the substrate surfaces. The Electron Microscope Imaging has given us a great indication of what our Atomic Force Microscope images should depict. Throughout the semester our intent was to manipulate the Atomic Force Microscope settings in an attempt to replicate the surface images previously obtained by the Scanning Electron Microscope. Figure 1: Photos in figure one depict the basic structure of an atomic force microscope. Using this instrument over the course of the semester we were able to obtain sub-micrometer sample surface images. During the beginning of the semester we collaborated with Dr. Kaczmarek as he has extensive experience working with atomic force microscopes. Dr. Kaczmarek’s experience caused us to discover some of the more advanced control settings and improved our imaging quality. Figure 6: The images in figure six depict the Nanosurf scanning tunneling microscope. The image on the right of figure six reveals the magnification window allowing viewing of the Pt/Ir wire as it approaches the graphite sample. Figure 4: A photograph of the Rolair quiet air compressor that was purchased with the Adrian Tinsley Program’s semester research grant. This compressor powers the Vibration isolation table that can be seen in figure three. Figure 3: A photograph of our Newport vibration isolation table with the atomic force microscope set up. Figure 7: A 100nm scan (left) and a 5nm scan (right) obtained from the scanning tunneling microscope. These images contain an extreme amount of noise which distorts the viewing of the carbon structure of graphite. Below is an image of a carbon nanotube obtained from the journal Chemical and Engineering News. This image depicts the individual carbon structure found within the carbon nanotube. Figure 2: In figure two we may observe an atomic force microscope image of a diffraction grating (top left). A diffraction grating sample was obtained from Plymouth Grating Laboratory. Plymouth Grating Laboratory also provided scanning electron microscope images of the obtained sample. Scanning electron microscope images of the diffraction grating may be observed in the bottom left and bottom right sections of figure two. In the top right image within figure two we may observe the atomic force microscope image of a Nanosurf calibration grid. Acknowledgements: Dr. Deveney and the Adrian Tinsley Program Figure 5: Figure five is a schematic breakdown of the atomic force microscope as well as the scanning tunneling microscope. This schematic image was illustrated by David P. Allison within the Nanoiomedicine and Nanobiotechnology journal. References: Allison, David P. "Atomic Force Microscopy of Biological Samples.“ Nanomedicine and Nanobiotechnology 2.6 (2010): 618-34. Print.