Meteorology
Meteorology. (1) Weather Instruments and Weather Maps. The Four Rules of Meteorology. Warm , moist air RISES ; this is LOW (L) surface pressure Cool , dry air SINKS ; this is HIGH (H) surface pressure *NOTE: H 2 O vapor is less dense than the N 2 and O 2 in our atmosphere .

Meteorology
E N D
Presentation Transcript
Meteorology (1) Weather Instruments and Weather Maps
The Four Rules of Meteorology Warm, moist air RISES; this is LOW (L)surface pressure Cool, dry air SINKS; this is HIGH (H)surface pressure *NOTE: H2O vapor is less dense than the N2 and O2 in our atmosphere. *NOTE, TOO: This process is the definition for : CONVECTION H pressure = “HAPPY” weather L pressure = “LOUSY” weather Air moves from H pressure to L pressure. Air around a H moves counter-clockwise, inward. Air around a L moves clockwise, outward.
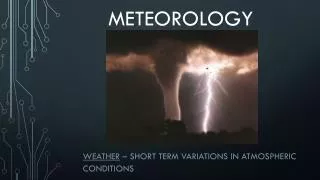
Weather Instruments Meteorologists collect data on current weather conditions to provide the most–accurate predictions about the weather. Watch and listen to this clip.
Weather Instruments Thermometers are used to measure temperature. Barometers are used to measure air pressure. Wind speed is measured with an anemometer. A wind vane is used to measure wind direction. A sling psychrometer is used to measure humidity. In order to measure multiple features of the upper atmosphere scientists use a radiosonde. A radio detection system that measures the velocity and locations of objects is called Doppler. Weather satellites and computers are used to collect and analyze weather data.
Recording the Weather Weather stations around the world collect and transmit data daily or hourly so that it can be used to create weather maps. To communicate the weather data, meteorologists use symbols. A cluster of symbols is called a stationmodel. A station model includes cloud cover, wind speed and direction and weather conditions. Air pressure, temperature and the dew point are also shown.
Answer these questions about the station model to the right:1. What is the air temperature? 442. What is the current cloud cover? 50%3. What is the current weather condition? shower4. What is the air pressure? 9985. What direction is the wind coming from? East
Reading a Weather Map An isotherm is a line that connects points of equal temperature. An isobar is a line on a weather map that connects points of equal pressure. Isobar lines that form closed circles represent high or low pressure systems. These areas are usually marked with a capital H or L. Closely spaced isobars mean that the wind will be strong/fast. Weather maps will show fronts and use colors to indicate precipitation. The color green often indicates rain. By comparing several weather maps (from previous hours or days) meteorologists can predict the weather.