Download
1 / 53
530 likes | 635 Vues
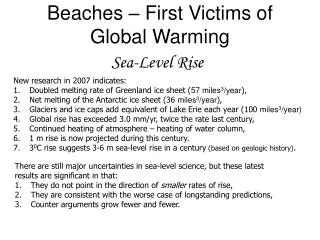
This guide presents an overview of Raster Analysis techniques applied in the context of sea level rise. Students will learn how to use ArcGIS tools for performing raster calculations, statistics (min, max, mean), and local zonal distance analysis. Key concepts include topography calculations (slope, aspect, contours) and reclassification of raster data. Important updates include the upcoming mid-term and a reminder about no class on Thursday. Resources for further understanding raster data models and functions will be provided.

E N D
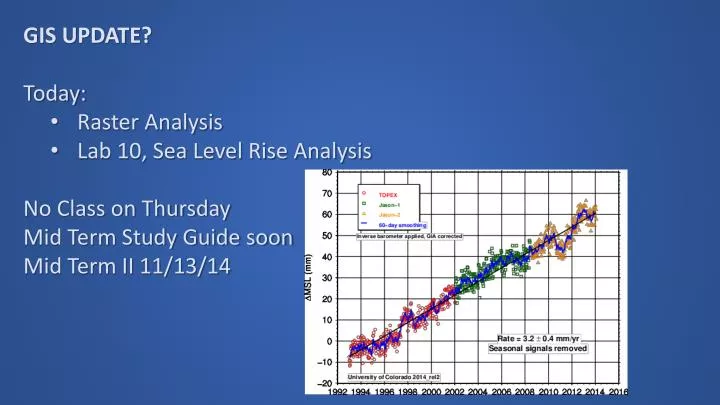
GIS UPDATE? • Today: • Raster Analysis • Lab 10, Sea Level Rise Analysis • No Class on Thursday • Mid Term Study Guide soon • Mid Term II 11/13/14
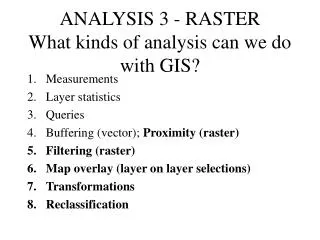
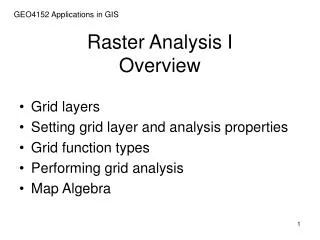
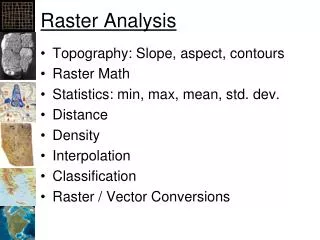
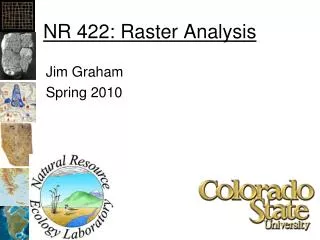
Raster Analysis Raster math Statistics: min, max, mean, std. dev. Local, Neighborhood, Zonal Distance (cost) Topography: Slope, aspect, contours Reclassify Raster / Vector Conversions Originally Developed by James Graham, modified by J. R. Patton
Raster Data Model Uses grid cells of a given dimension to represent the value or attribute of a real world entity or phenomenon
The value may be a measurement or a code. Cell values are numeric: can be either positive or negative, integer, or floating point.
Images: True Color Composite (multi-band raster data set; 3 raster layers; 1 each for RGB) Spectral Reflectance
ArcGIS Data Types * ArcGIS documentation indicates the GRID values are always stored as 32-bit values See: http://www.esri.com/news/arcuser/1002/files/table_2.pdf, http://webhelp.esri.com/arcgisdesktop/9.3/index.cfm?TopicName=Bit_depth_capacity_for_raster_dataset_cells, http://webhelp.esri.com/arcgisdesktop/9.3/index.cfm?topicname=Technical_specifications_for_raster_dataset_formats
Computer-Based Numeric Data Types See: http://en.wikipedia.org/wiki/Integer_overflow, http://steve.hollasch.net/cgindex/coding/ieeefloat.html
Dana Tomlin and Joseph Berry (1970’s) A method of treating individual raster layers as members of algebraic expressions 2 * LayerA
LayerA + LayerB Arithmetic Operators (+, -, *, /) Mathematical Functions (Sqr, Sqrt, Log, Abs, exp, int, etc.) Comparison Operators (>, >=, =, <>, <, <=) Boolean Operators (AND, OR, NOT, XOR)
Toolbox → Spatial Analysis Tools → Map Algebra → Raster Calculator
= -
Local: Arithmetic: +,-,/, *, MOD (Modulo): returns the remainder Boolean: OR: If either input is true, output is true AND: If both inputs are true, output is true CON (Conditional)
Abs (absolute): flips negatives to positive • Ceil (ceiling): float to integer next highest integer value (i.e. 1.1 -> 2) • Floor: float to integer giving next lowest integer value (i.e. 1.1 -> 1) • Int (integer): truncates float to integer
<> (Not Equals) • == (Equals) • < (Less than) • <= (Less than or equal to) • > (Greater than) • >= (Greater than or equal to)
Raster Math: Boolean AND 0 AND 1 = 0 = AND “AND” works but the calculator will insert “&”
Raster Math: Boolean OR 0 OR 1 = 1 = OR “OR” works but the calculator will insert “!”
Map Algebra Examples: Fire Hazard: [Fuel Density Hazard] + [Slope Hazard] + [Veg Type Hazard] Probability of encountering the cascade treefrog (Litoriapearsoniana) within the forests of eastern Australia: 1 / (1 + exp(10.48 – 2.204 * log10(RAINFALL) – 2.037 * PALMS)) RAINFALL= the annual volume of rain falling in the watershed above the stream PALMS = 1 if palms are present at the site and 0 otherwise.
Raster Analysis: reclass Identifying suitable habitat South facing slopes aspect between 150 and 200 degrees. Slope < 20 degrees Green = suitable slope (cell value = 1) Red = unsuitable slope (cell value = 0) Green = suitable aspect (cell value = 1) Red = unsuitable aspect (cell value = 0)
Identify Slope < 20 degrees (Alternative method) “Slope” < 20
“suitable aspect” * “suitable slope” suitable_habitat
Cell value = 1… Suitable slope & Suitable aspect = *
“No-Data” or NULL Values • Rasters are always rectangular • No-Data values are “transparent” and are not used for calculations
Land cover Digital Elevation Model (DEM)
Raster Sources • Scanned • Topos • Remotely Sensed • Aerial Photos • Satellite Photos • Digital Elevation Models (DEM) • Derived Rasters • Hill shade • Slope • Aspect • Statistical Spatial Analysis
Digital Elevation Model (DEM) Each pixel value is an elevation
Digital Orthophoto Quarter Quad (DOQQ) 1 meter aerial photos
7 Bands • 30m, 15m bw • Entire earth LandSat • Twice a month • 26 years of coverage • “Free” • EROS Data Center
National Land Cover Dataset (NLCD) Based on Landsat Imagery 21 Classes based on cover type
1992 2006 2001
Derived Rasters • Land Cover from satellite and aerial • Topography: Slope, aspect, hillshade • Ecoregions • Suitable Habitat • Flood plains • Geological Regions
GeoReferenced File Formats • GRID: ESRI’s format • GeoTIFF: Excellent support • MrSID: LizardTech • IMG: ERDAS • ECW: ERMapper • BIL, BIP, BSQ: See header • “ASCII” or “GRID ASCII” (asc) • Lots of others…
Conversions • Raster to Point: • Raster to Point • Raster to Polyline: • Countour • Streams • Raster to Polyline • Raster to Polygon: • Viewsheds • Watershed • Raster to Polygon • Point to Raster • Interpolation • Density • Point to Raster • Polyline to Raster • Polyline to Raster • Polygon to Raster • Polygon to Raster
Raster Analysis • Raster math • Statistics: min, max, mean, std. dev. • Local, Neighborhood, Zonal • Distance (cost) • Topography: Slope, aspect, contours • Reclassify • Raster / Vector Conversions
Raster Statistics • Local • Operate on one pixel in each raster • Neighborhood (or Focal) • Operate on a few pixels around each pixel • Zonal • Collection of regions • Region is a contiguous area of the same pixel values • Global • Operate on the “whole” raster
Local Stats • “Cell Statistics” computes stats on all the values for a pixel in a multi-band raster. • Example for “Sum”: Esri ArcGIS 10 Help
Neighborhood (or Focal) Columns • Result=Operation on pixels nearby Rows
Focal Statistics • Computes stats on pixels around an existing pixel • Example for Sum: Esri ArcGIS 10 Help
Zonal Statistics • Computes statistics for defined regions (features) • Tools: • Zonal Statistics: • Outputs a raster (not sure of the value) • Zonal Statistics as Table: • Outputs a table • Used to compute all kinds of valuable things: • Percent land cover • Percent impervious cover • Percent water below a certain depth • Etc.
Zonal Statistics Zone Layer Value layer Output layer (or table) Esri ArcGIS 10 Help
Conditional Operator • Con(<condition>,<true>,<false>) • Given a raster “condition”: • Puts the true value where true and false value where false Con!
Elevations over 3000 meters • Con("W100N40.DEM“>3000,0,1)
Mosaic Rasters • Data Management Tools -> Raster -> Raster Dataset -> Mosaic to new Raster