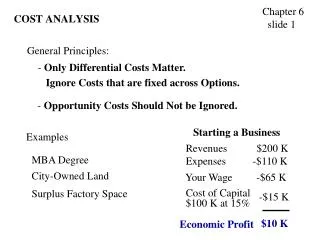
Cost Analysis: Understanding Methods & Applications
Learn the importance of cost management, differentiate value-added activities, analyze cost behavior with methods like account analysis & regression, and avoid pitfalls in cost behavior analysis.

Cost Analysis: Understanding Methods & Applications
E N D
Presentation Transcript
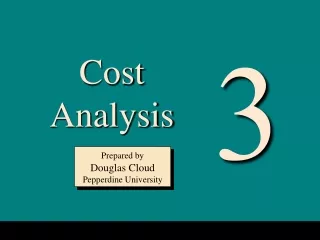
3 Cost Analysis Prepared by Douglas Cloud Pepperdine University
Objectives • Understand the importance of cost management. • Describe the two aspects of managing costs. • Distinguish between value-added and non-value-adding activities and costs. • Describe and use methods of analyzing cost behavior. • Understanding the limitations of methods of cost behavior and analysis. • Classify costs along several dimensions including whether managers can change them at short notice. After reading this chapter, you should be able to:
Cost Drivers and Pools Activities that cause costs are cost drivers and include sales, production, and items such as the number of products the company makes and the number of customers it serves. A group of costs driven by the same activity is a cost pool.
Estimated Cost Behavior Fixed Cost Behavior Variable Cost Behavior $ $ Activity Activity Unit Cost Varies with Volume Unit Cost Rate is Constant
Variable Costs Estimated Cost Behavior Mixed Cost Total Costs $ Cost Fixed amount Number of Units Produced Total Costs = Fixed Amount + (Variable Cost Per Unit x Number of Units) Total Costs = Fixed Costs + Variable Costs
Estimating Cost Behavior • Account Analysis • Engineering Approach • Interviews • The (High-Low) Two-Point Method • Scatter-Diagram Method • Regression
Account Analysis Manager decides how to classify a cost by looking at its name and then checking this judgment by scanning the account for that cost for several periods. Example: Rent, depreciation, salaries, and advertising are generally fixed. Weakness: It only shows what costs have been, not what they should be.
Engineering Approach Engineers study the material and labor requirements of products and related operations, then make per-unit estimates of the costs that should vary with production. Advantage:It indicates what costs should be rather than what they have been.
Interviews This is a simple tool that has proven useful in determining what drives many costs, and to determine what is likely to happen to particular costs, given specific actions. Advantage:It does help to identify cost drivers. Weakness:Interviewing does not help determine how much of a particular cost is fixed or variable.
High-Low (Two-Point) Method The high-low (two-point) method is a relatively unsophisticated, yet widely used, method of estimating the components of a mixed cost. Approach: This method uses two past levels of activity and the amounts of the cost incurred at those levels; more specifically, the highest and lowest levels of activity.
Variable cost component of mixed cost change in cost change in activity $40,800 – $14,800 18,000 – 5,000 = Variable cost component of mixed cost = Variable cost component of mixed cost $26,000 13,000 $2 per machine hour = = High-Low (Two-Point) Method
variable cost components Fixed cost component of mixed cost Fixed cost component of mixed cost Fixed cost component of mixed cost total cost – x volume = = = $40,800 – (18,000 x $2) $4,800 High-Low (Two-Point) Method At the high point: 18,000
variable cost components Fixed cost component of mixed cost Total cost at low volume Fixed cost component of mixed cost total cost – high volume x = = $14,800 $4,800 High-Low (Two-Point) Method At the low point: 5,000 machine hours = Less variable portion (5,000 x $2) 10,000
Scatter-Diagram Method The scatter-diagram (or graphical) method requires cost and volume data from prior periods, and derives an equation (cost prediction formula) based on those data. Weakness:The placement and slope of the line are matters of judgment; the manager “eyeballs” the data and fits the line visually.
Analyst can fit line based on his or her experience Scatter-Diagram Method Maintenance Cost $45,000 35,000 25,000 20,000 10,000 7.2 5,000 0 x x x x x x x x x 0 2 4 6 8 10 12 14 16 18 20 (Thousands) Machine Hours
Regression Method Regression analysis (or just regression) is a more sophisticated method for estimating the fixed and variable components of a mixed cost. Regression uses cost and volume data from prior periods to yield an equation of the form y = a + bx. The appendix covers regression in more detail.
Problems and Pitfalls in Cost Behavior Analysis Historical Data • High-low, scatter-diagram, and regression methods all use historical information. • Formulas based on historical data can give useful predictions only if past conditions prevail in the future. • Outliers should be ignored
Problems and Pitfalls in Cost Behavior Analysis Correlation and Association For an equation to be useful for planning, the relationship between the cost and the activity must be fairly close. The visual aspect of the scatter-diagram method allows the manager to see whether the activity chosen as the independent variable is a good predictor of cost.
Narrow Width Step Variable Costs Linearity Assumption $ Cost Number of Units Produced
Definitions Discretionary costs are fixed costs that can be quickly altered by managerial action. Example: Advertising, employee training, and research and development Committed costs are fixed costs that cannot be changed so quickly. Example:Depreciation
Definitions • Avoidable costs are costs that can be avoided by adding, dropping, or curtailing some activities. • Example: Advertising, sales salaries A company that drops a product line might not be able to reduce its sales force or its rent. Such costs are unavoidable.
Definitions A direct cost is incurred specifically because of a particular activity of a firm, like a product line, or geographical area. Direct costs are sometimes called separable or traceable costs. An indirect cost does not relate to one specific activity, but rather to several. An indirect cost is sometimes called a common or joint cost.
Manufacturing Costs • Direct materials • Direct labor • Manufacturing overhead
Regression Output (Appendix) Regression Output: Constant $7,731.78 Standard Error of Y Estimate $1,763.16 R Squared .0954921 No. of Observations 12 Degrees of Freedom 10 X Coefficient(s) $1.76678 Standard Error of Coefficient $0.12139 Model: Y = $7,731.78 + $1.76678X
Goodness of Fit (Appendix) Goodness of fit tells us how well the regression line fits the data, and therefore suggests to managers how good their predictions are likely to be. Two potential measures are: 1. the coefficient of determination (R-squared). 2. the standard error of the estimate (Standard Error of Y Estimate).
Multiple Regression Equation (Appendix) Y = a + b1X1 + b2X3 + … + bnXn
Chapter 3 The End