
Supplementary Figure 1
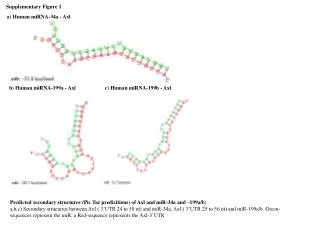
Supplementary Figure 1. a) Human miRNA-34a - Axl. b) Human miRNA-199a - Axl. c) Human miRNA-199b - Axl.

Supplementary Figure 1
E N D
Presentation Transcript
Supplementary Figure 1 a) Human miRNA-34a - Axl b) Human miRNA-199a - Axl c) Human miRNA-199b - Axl Predicted secondary structures (Pic Tar predicitions) of Axl and miR-34a and –199a/b:a,b,c) Secondary structures between Axl ( 3’UTR 24 to 50 nt) and miR-34a, Axl ( 3’UTR 25 to 56 nt) and miR-199a/b. Green-sequences represent the miR; a Red-sequence represents the Axl-3’UTR
Supplementary Figure 2 H1299 Rko 1 2 3 1 2 3 c-Met Notch 1 HIF1 a β-Actin 1: Control-miR 2: PM-miR-34a 3: PM-miR-199a H1299 and Rko cells were transfected either with miR-34a or -199a. After 48h, protein was isolated and Western blot analysis was performed for c-Met, Notch 1 and HIF1a. β-Actin served as internal control.
Rko MDA-MB-231 HCT116 10000 100000 1000 1000 100 1000 100 10 10 10 1 1 0.1 0.1 0.1 miR-34a miR-34a miR-34a Con-miR Con-miR Con-miR miR-199a miR-199a miR-199a Supplementary Figure 3 a) PM-miRNA expression H1299 10000000 1000000 10000 Relative miR expression (Log Scale) 100 0.1 miR-34a Con-miR miR-199a b) AM-miRNA expression A549 MCF7 Colo 320 1.2 1.2 1.2 1.0 1.0 1.0 0.8 0.8 0.8 0.6 0.6 0.6 Relative miR expression 0.4 0.4 0.4 0.2 0.2 0.2 0.0 0.0 0.0 miR-34a miR-34a miR-34a Con-miR Con-miR Con-miR Expression levels of either PM-miR-34a and -199a:H1299, MDA-MB-231, Rko and HCT116 cells were transfected either with PM-miR-34a or PM-miR-199°, and A549, MCF-7, Colo 320 cells were transfected with AM-miR-34a. After 48h, miR expression levels were determined with Real-Time PCR.
1000 100 10 1 0.1 Geo Rko WiDr HT-29 SW480 HCT15 HCT116 Colo 320 Colo 206f 10000 6000 1000 8000 4000 6000 100 4000 2000 10 2000 0 0 1 Rko Geo WiDr HT-29 HCT15 SW480 Colo206f A549 H460 H522 H596 H520 0.1 Colo 320 HCT116 Calu-1 H1395 H1299 Calu-3 LXF289 SK-MES 1 Supplementary Figure 4 a) NSCLC BRC CRC Relative miR-34a expression (Log scale) Relative miR-34a expression Relative miR-34a expression MDA-MB-231 MCF-7 NSCLC BRC CRC b) 250 6 200 4 Relative miR-199a expression(Log scale) Relative miR-199a expression Relative miR-199a expression 150 100 2 50 0 0 MDA-MB-231 H460 A549 H522 H596 H520 H1299 H1395 Calu-3 Calu-1 MCF-7 LXF289 SK-MES-1 miR-34a- andmiR-199a-endogenous expression:Relative miR-34a and miR-199a levels in the panel of NSCLC, BRC and CRC cell lines evaluated by Real-Time PCR
300 10000 250 1600 1000 200 1200 100 150 800 10 100 400 1 50 0.1 0 0 Rko WiDr Geo HT-29 SW480 HCT15 Colo206f Colo 320 MDA-MB-231 HCT116 MCF-7 1.2 3 0.8 2 0.4 1 0.0 0 A549 MDA-MB-231 H460 H522 H596 H520 H1299 Calu-1 H1395 1 2 3 4 5 6 7 8 9 10 11 12 13 14 15 16 17 18 19 20 21 22 Calu-3 MCF-7 LXF289 SK-MES 1 Axl β-Actin Supplementary Figure 5 NSCLC BRC CRC a) Relative Axl mRNA expression(Log scale) Relative Axl mRNA expression Relative Axl mRNA expression A549 H460 H596 H522 H520 Calu-1 H1395 H1299 Calu-3 LXF289 SK-MES 1 NSCLC BRC CRC b) 1.6 1.2 0.8 Axl Protein ratio: (Axl/Actin) Axl Protein ratio: (Axl/Actin) Axl Protein ratio: (Axl/Actin) 0.4 0.0 Rko Geo WiDr HT-29 HCT15 SW480 Colo206f HCT116 Colo 320 c) 130 kDa 43 kDa 1)Calu 3; 2)A549; 3)H460; 4)H520; 5)LXF-289; 6) H1395; 7)Calu1; 8)H596; 9)H522; 10)SK-MES-111)H1299; 12)MDA-MB-231; 13)MCF-7; 14)Rko; 15)HCT116; 16)SW480; 17)Colo 320; 18) HT-29; 19)HCT1520)WiDr; 21)Geo; 22) Colo 206f Axl endogenous expression in NSCLC, BRC and CRC cell lines:a) Relative Axl expression in the panel of NSCLC, BRC and CRC cell lines evaluated by Real-Time PCR, β-Actin served as internal control. b) Axl densitometric Western blot analysis. The density ratio of Axl/-Actin is represented as a bar graph. c) Axl protein amounts (Western blot analysis, β-Actin served as internal control) in NSCLC, BRC and CRC cell lines.
R= -0.75; p<0.01 R= 0.41; p=0.03 Invasive ability Invasive ability Log[miR-34a expression] Axl protein expression R= -0.81; p<0.01 Axl protein expression Log[miR-34a expression] Supplementary Figure 6 a) Axl-protein vs invasion b) miR-34a-expression vs invasion c) miR-34a-expression vs Axl-protein Correlations between invasion, miR34a- and Axl-endogenous expression in NSCLC cells:a)Axl protein vs invasion, b) miR34a-expression vs invasion, c) miR-34a expression vs Axl protein in a panel of NSCLC cell lines (p-value is from Spearman’s correlation test).
Supplementary Figure 7 a) b) H1299 Rko 14 14 12 12 10 10 * * 8 8 * 6 6 Percent of cells migrated Percent of cells migrated 4 4 * 2 2 0 0 Control-miR miR-34a miR-199a Control-miR miR-34a miR-199a miR-34a and -199a inhibits migration in Boyden chambers:H1299 and Rko cells were transfected and plated in the upper chamber, and after 12h top and invaded cells were counted as described for matrigel assays in materials and methods. a,b) both the miRs (miR-34a and 199a) significantly reduced migration of H1299 and Rko cells. Data represented as the percentage of invading cells, as mean ± SD of four replicates (*p0.05)
Supplementary Figure 8 Axl (NM_021913 ): Chromosome 19 miR-34a (MI000268) : Chromosome 1 miR-199a1-5p (MI0000242): Chromosome 19 miR-199a2-5p (MI0000281): Chromosome 1 miR-199b-5p (MI0000282) : Chromosome 9 Methylation status of Axl, miR-34a and miR-199a/b promoters:2000 bp or more bases were taken from the TSS or upstream sequence from the pre-miR chromosomal location for CpG islands. Horizontal small red lines represent the CpG island, and a thick black underline represents the region taken for methylation analysis


