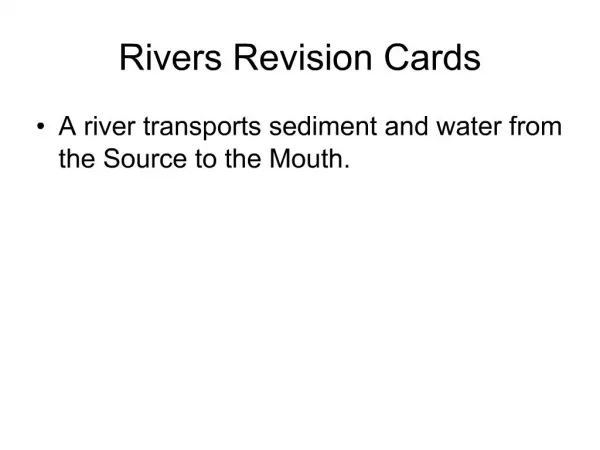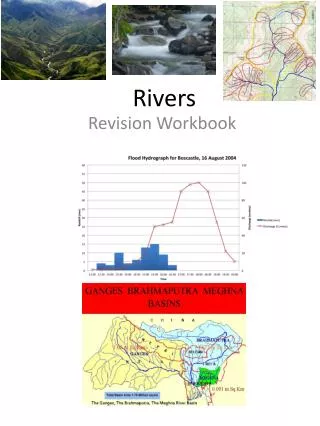
Rivers Revision
Rivers Revision. SDME preparation Jan 2012 A Damming report- why are some strategies for flood management more sustainable than others?. The outline- 14 lessons till exams.

Rivers Revision
E N D
Presentation Transcript
Rivers Revision SDME preparation Jan 2012 A Damming report- why are some strategies for flood management more sustainable than others?
The outline- 14 lessons till exams • Revision- causes- hydrological cycle, drainage basin system, storm hydrographs, influences on the shape of hydrographs and examples of flooding in MEDCs and LEDCs • Use the resource booklet to plan for the exam • Plan and write decision making answers
The drainage basin system transpiration precipitation Interception stemflow infiltration Surface run off Soil moisture storage percolation throughflow Groundwater storage Groundwater flow River
Use P • Use the drainage basin system diagram • How can humans influence the diagram / what areas cant humans influence
Hydrographs Peak discharge Falling limb Rising limb storm flow normal (base) flow I = Lagtime Peak rainfall Write a definition of lagtime. Calculate the lagtime shown on this hydrograph.
What are Hydrographs? Hydrographs are graphs which show river discharge (the amount of water in a river) over a given period of time and show the response of a drainage basin and its river to a period of rainfall. Discharge is measured in cumecs (cubic metres per second). This can be calculated by multiplying river velocity by channel volume at a given point and time.
Success criteria • Using the graph paper and information • Create bars of the rainfall • Create a line of the flow • Either stick on the labels of the features of a hydrograph or write them out and add labels • Then using the scenarios- work out where each scenario goes on the graph- give reasons for your answer
Variations in the shape of a Hydrograph: The shape of a hydrograph is determined by the speed in which flood waters are able to reach the river. The nature of the drainage basin therefore has a great influence on the way a river responds to a river as it will determine the types and speeds of the flow of water to the river.
Sketch diagram time... • Can you draw a label sketch diagram of: • A general flood hydrograph. • A flood hydrograph for a drainage basin that experiences a storm just after a new housing estate has been built. • A flood hydrograph for a drainage basin that has lots of vegetation.
What is a drainage basin? • How does the drainage basin system operate? • What is a flood hydrograph? • What factors influence the shape of a flood hydrograph? Learning objectives
Success criteria • Draw different shaped storm hydrographs • Sort factors into the two shaped graphs to show how it influences the shape of the response • Read storm hydrographs correctly from an example and explain using knowledge of the drainage basin system and drainage basin characteristics why storm hydrographs have certain shapes and response times.
Hydrographs Geology and soil Gradient of the valley sides What affects the shape of a hydrograph? Land use Drainage density Type and amount of precipitation
How do trees reduce flooding? trees intercept the rain evapotranspiration reduces the amount of water that reaches the river water is taken through the roots and so less enters the river
What factors influence the shape of a hydrograph? The hydrographs ‘a’ and ‘b’ have been produced from the same storm event but from different drainage basins.
Hydrographs What could cause 2 peaks in a hydrograph?
Hydrographs Compare these two hydrographs. Which one has the largest lag time? Explain your answer.