Scientific Method
Learn the key steps of the scientific method, from making observations and conducting research to forming hypotheses, setting up experiments, collecting data, drawing conclusions, and making predictions. Explore the vocabulary and techniques used in scientific experiments.

Scientific Method
E N D
Presentation Transcript
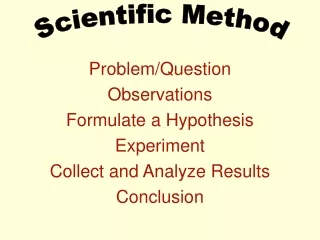
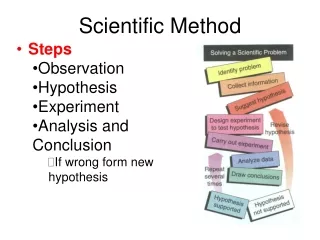
Scientific Method • Steps of the Scientific Method • Observation • Performing research • Forming a Hypothesis • Setting up an Experiment • Collecting and Presenting Data • Drawing conclusions • Making a prediction
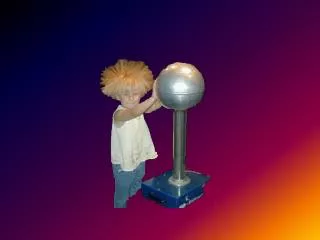
Natural Phenomena • Are observable facts or events in the world around us, like clouds. • Some scientists believe all natural phenomena have logical, verifiable explanations - sometimes it just takes some thought, and effort to find them
Making Observations and Defining the Problem • Observations are made by using the 5 senses-sight, touch, taste, smell and sound • Some observations are very subtle like the wind blowing in your face. • Other observations catch your attention immediately, like seeing a hot air balloon.
Making Observations and Defining the Problem • Feeling the wind on your face is a natural phenomena, where the hot air balloon is man made and therefore a technological innovation.
Making Observations and Defining the Problem • Lets use the hot air balloon as our observation. • Although we can see the hot air balloon, we can only see the effects of the wind on the object. We also know that gravity plays a role on the balloon. There are many other factors that play a role in how the balloon works.
Making Observations and Defining the Problem • From all of these observations you are then able to create a question. Our question is How high can a hot air balloon go?
Performing Research • Research can be done on many levels-how much you need to do and where you need to look depends on the problem you are investigating. • For some research about natural phenomena you may be able to Google it on the internet, but beware because the information on the websites are not always reliable.
Performing Research • Here is a chart to help you with the reliability of a website.
Performing Research • A journal is a specialized publication. It is different from a magazine in these way: • Authors are not paid • Authors must follow a specific set of rules • The articles are peer-reviewed- read over by an anonymous scientist in the same field.
Forming a Hypothesis • Inductive Reasoning: The ability to draw from a set of knowledge and experience to make a general explanation. • Deductive Reasoning: Involves reasoning from a general principle to a specific case.
Setting Up The Experiment • Scientific Experiment: Is designed to prove or disprove the hypothesis. • Independent Variable: They are the ones that the experiment is trying to test. • Dependent Variable: Changes in response to the Independent Variable. • Control Variables: All the other factors, what you try to keep constant through out the experiment.
Setting Up The Experiment • Experimental Group: The group that will be tested. • Control Group: The group that the Experimental Group is being tested against.
Collecting And Presenting Data • Qualitative Data: The observation made with your senses. Ex: Color, Texture, Taste, Smell. • Quantitative Data: The measurements. Anything that is expressed as a number. Ex: Lengths, Weight, Masses, Volumes, Time, Temp.
Collecting And Presenting Data • Qualitative Data is subjective: meaning that its recording depends on the person. • Quantitative Data is objective: meaning it does not depend on the person recording.
Collecting And Presenting Data • Both Qualitative and Quantitative Data can be displayed in a Data Table. • The point of the is to make it clear so that your can begin to see Trends. • A good way to display the trends is in a Diagram.
Collecting And Presenting Data • Diagrams such as: • Line Graphs • Multiple Line Graphs • Circle Graphs / Pie Charts • Bar Graphs • Etc.
Drawing Conclusions • A conclusion is a judgment based on observation and experimentation. • An inference involves using your conclusion as a starting point in inductive reasoning. • A model is a mathematicaldescription of an event.
Natural Phenomena Hypothesis Five Senses Observation Dependent Variable Control Variable Experimental Group Control Group Qualitative Data Independent Variable Conclusion Inference Model Research Journal Peer Review Inductive Reasoning Quantitative Data Diagram Table Graph Chart Deductive Reasoning Scientific Experiment Variable Prediction Scientific Method Vocab.