CBFWA Development of Research, Monitoring & Evaluation Amendments
180 likes | 526 Vues
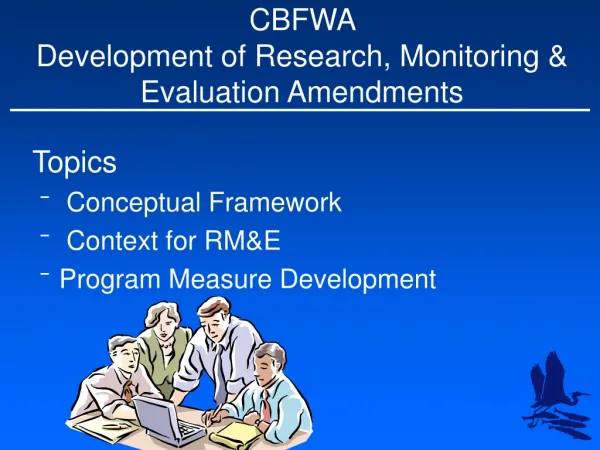
CBFWA Development of Research, Monitoring & Evaluation Amendments. Topics Conceptual Framework Context for RM&E Program Measure Development. Conceptual Framework. Recovery Bar. De-listing Bar. Monitoring Context. Evaluation Context.

CBFWA Development of Research, Monitoring & Evaluation Amendments
E N D
Presentation Transcript
CBFWA Development of Research, Monitoring & Evaluation Amendments Topics • Conceptual Framework • Context for RM&E • Program Measure Development
Conceptual Framework Recovery Bar De-listing Bar
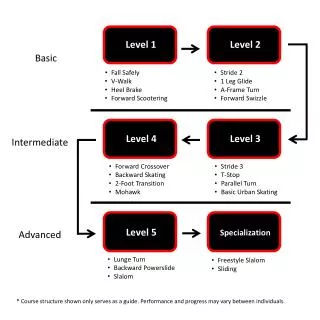
Monitoring Context Evaluation Context Utilizing monitoring frameworks and projects (e.g., SOTR, FPC, CSS, AFEP, CSMEP, etc.), evaluate and coordinate monitoring programs and provide reports and updates to federal, state and tribal fish managers and sovereigns. Level 1: ESU Status and Trend Monitoring. Selected pops from ESUs throughout basin. Track adult abundance, full life-cycle productivity, distribution and diversity relative to viability criteria. Level 2: Overall FCRPS Effects and Combined Action Effectiveness. Aggregated hatchery and hatchery fish from Level 1 pops and comparable pops with less hydrosystem experience. Track overall FCRPS and other all-H effects relative to FCRPS responsibility. Level 3a: Specific FCRPS Action Effectiveness. Utilizing or expand as necessary, fish marked and monitored in Level 2, evaluate the effectiveness of specific FCRPS actions relative to identified performance standards. Research Context Utilizing the Evaluation Context identified above as well as additional scientific resources, resolve critical uncertainties and test key assumptions within Levels 1-3 Level 3b: Specific FCRPS Other-H Action Effectiveness. Utilizing or expand as necessary, fish marked and monitored in Level 1 and 2, evaluate the effectiveness of specific FCRPS other-H actions relative to identified performance standards.
LEVEL 1 LEVEL 2 LEVEL 3a LEVEL 3b Monitoring Context Hatcheries and Tributary habitat SpawnerAbundance Freshwater Smolts-per-Spawner Eggs Upper Dam Direct survival through Direct adult Dams survival Mainstem through Direct Dams Hydro survival transported Fish Bonneville Dam Harvest SARs Estuary Recruits/ Spawner Ocean
Evaluation Context • Build upon existing and functioning collaborative monitoring frameworks and projects that involve state, tribal, and federal managers • Integrate RME programs basin-wide to maximize efficiency and multiple application to management questions • Evaluate and coordinate monitoring programs to maintain long-term continuity and consistency of established migration data time series • Provide routine and periodic reports and updates of data time series such as survival, timing, travel time, passage distribution and smolt-to-adult return EvaluationContext
Reporting Adaptive Management • Current Status, Biological Objectives, Limiting Factors & Threats, Strategies & Measures, Monitoring, Reporting, Evaluation and Adjustment • Groups provide recommendations for changes in local monitoring to inform regional information needs • Level 1: (CSMEP & SOTR) Annual characterization of VSP parameters or performance targets Habitat Status & Trends - coordinate with land/water quality managers: AREMP, PIBO, EPA • Level 2: (CSS) Annual Overall FCRPS Effects, SMP/FPC annual report • Level 3: Specific Action Effectiveness Monitoring • Level 3a: Hydro: Improved collaboration in AFEP • Level 3b:Hatchery & Harvest – TAC & CSMEP Habitat – Track implementation, ISEMP, Okanogan, WA. IMWs EvaluationContext
Research Context • Use and build on scientific resources described in the evaluation context to resolve critical uncertainties and test key assumptions • Maximize application of present data to address new and innovative analyses, while designing RME mark groups to support additional analysis ResearchContext
Program Measures 1 of 8 Level 1 – Support sampling, tagging and tag recoveries for selected populations from throughout the Basin to assess: • Abundance • Full life-cycle productivity • Spatial Structure and Diversity
Program Measures 2 of 8 Level 2 – Support sampling, tagging and tag recoveries to assess SARs of population groupings (ESU, MPG, etc) with more and less hydrosystem experience
Current Annual PIT-tagging Targets for Hatchery and Wild Smolts by General Release Area Level 2 PIT-tag needs
Additional Need for Annual PIT-tag Releases of Hatchery and Wild Smolts by General Release Area Level 2 PIT-tag needs
Program Measures 3 of 8 Level 3a Hydrosystem Action Effectiveness Monitor key metrics to track and report responses to hydrosystem actions: • Juvenile arrival timing • Spill Passage Efficiency • Passage delay at the project • Survival - forebay BRZ to tailrace BRZ • In-river survival rate (upper dam forebay to lower dam tailrace)
Program Measures 4 of 8 Level 3b - Habitat Action Effectiveness • Project implementation monitoring to assure projects are in place and functioning • Habitat effectiveness monitoring guidance • Monitoring that focuses on Intensively Monitored Watersheds (IMWs) to assess the effectiveness of project types
Program Measures 5 of 8 Level 3b - Hatchery Action Effectiveness Integrate monitoring types over a regional framework: • Monitor of status and trends for supplemented and reference populations • Conduct monitoring associated with Hatchery Genetic Management Plans (e.g. hatchery stray rates, relative reproductive success, etc)
Program Measures 6 of 8 Level 3b - Harvest Action Effectiveness • Improve estimates of stock composition in fisheries (PIT-tag recoveries & GSI sampling) • Improve interface between Columbia River and ocean fisheries models • Increase monitoring of encounter rates to better characterize harvest impacts in fisheries that release by catch
Program Measures 7 of 8 Evaluation Context – Support key functions of collaboration projects: • Status of the Resource • Fish Passage Center • Comparative Survival Study • Collaborative Systemwide Evaluation Project • Anadromous Fish Evaluation Program
Program Measures 8 of 8 Research Context – Identify critical uncertainties to address (e.g.): • Implications of biological differences that might explain mortality patterns such as juvenile arrival timing at downstream sites, ocean distribution, size differences, passage distribution, adult size and age structure on comparisons among stocks • Genetic differences that might impact differing responses to environmental changes