Download
1 / 33
340 likes | 470 Vues
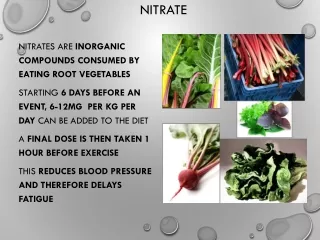
The Pre-Sidedress Nitrate Test (PSNT) is essential for effective nitrogen management in corn farming, especially in humid regions. It helps determine the nitrate-nitrogen levels in the soil when corn plants are 6 to 12 inches tall, allowing farmers to adjust their nitrogen fertilizer applications. This test accounts for various factors affecting nitrogen availability, including organic amendments and weather conditions. Understanding PSNT results aids in minimizing nitrogen losses due to leaching and denitrification, thereby optimizing yield while preserving environmental quality.

E N D
The Pre-Sidedress Nitrate Test PSNT Fred Magdoff Plant & Soil Science University of Vermont fmagdoff@uvm.edu
The Nitrogen Challenge • Needed in large amounts • A very dynamic nutrient. • Losses (leaching, denitrification) can occur rapidly, especially as a result of rainfall and under maize in humid regions. Slide modified from van Es, et al., Cornell University
The Pre-Sidedress Nitrate Test PSNT 1.) Use minimal preplant or banded N 2.) Sample soil to 1 ft when corn is 6 to 12 inches tall. Analyze soil for NO3-N
Slide modified from van Es, et al., Cornell University Sources of N for Plants Urea/ammonium fertilizer Sod organic matter
Slide from van Es, et al., Cornell University Denitrification (and nitrification) losses NH3 volatilization losses Surface runoff losses Crop N uptake Nitrate-N Leaching losses Pathways for N loss
Denitrification losses Coarse Textured Soil Fine Textured Soil Nitrate-N Leaching losses Slide from van Es, et al., Cornell University Denitrification vs. Leaching LossesEffect of Soil Type
Slide from van Es, et al., Cornell University Over-Fertilization Results in N Leaching Losses N LEACHING LOSSES (kg ha-1) same yield
Pattern and variability of soil nitrate and plant uptake (7 seasons in Ontario) plant + soil N plant N soil inorganic N Kay, B.D., A. A. Mahboubi, E. G. Beauchamp, and R. S. Dharmakeerthi. 2006. Integrating Soil and Weather Data to Describe Variability in Plant Available Nitrogen. Soil Sci. Soc. Am. J. 70:1210–1221. Slide from van Es, et al., Cornell University
Recent sod + manure Sample soil and apply N Depleted soil Why does it work? Corn N uptake Soil nitrate planting 12” tall
Soil nitrate plus N uptake Fertilizer N Depleted soil Sample soil and apply N planting 12” tall
Sampling time PSNT critical value J J A M S O N 40 SA '89 (1st yr after alfalfa) 35 Fay '90 (manure) 30 Shelburne '78 (2nd yr corn following long term sod) 25 Rich. '78 (high sludge) NO3 -N in surface 30 cm (ppm) 20 Fay '90 (no manure 2 yrs) 15 Rich. '78 (cont. corn) Fletcher '89 (run-out hay) 10 5 0 250 200 300 350 100 150 day of the year
1.2 1 0.8 Critical PSNT value 0.6 0.4 0.2 0 0 20 40 60 80 100 PSNT and Corn Relative Yield VT, PA, CT, NH, and NY: 1981-1989 (272 data points) Relative Yield Yield no N Yield +N PSNT (NO3-N, ppm)
200 250 Critical PSNT value 200 150 100 50 0 -50 0 20 40 60 80 100 PSNT and Corn Response to added N Percent yield increase with N sidedress PSNT (NO3-N, ppm)
When samples are submitted in Vermont, the accompanying form indicates • Manure use • N fertilizer applied • Drainage • Years since sod crop • Type of sod crop
The PSNT is integrates climate, recent organic additions, and soil factors up to the time the test is taken.
0 5 0 1 0 0 1 5 0 M B M B + M Manure N Availability for Silage Corn 1986 vs. 1987 (Addison Co., VT) PSNT: 10 ppm 8 ppm 16 ppm 32 ppm 3 0 2 5 2 0 Silage Yield, T/A 1 5 1 0 1986 1987 5 0 MB +M MB
34 32 30 years after sod PSNT (NO3-N, ppm) 28 1 26 2 & 3 4& 5 24 22 20 18 .5 1 1.5 2 2.5 3 3.5 4 4.5 5 manure rate PSNT of routine samples submitted to UVM’s A&TL for 1995 and 1997 through 2000.
1997 1998 1999 2000 Moving average of PSNT (last 90 samples 65 60 55 50 PSNT ave. of last 90 samples (ppm) 45 40 35 30 25 20 15 5 10 15 20 25 30 5 10 15 20 25 June July
Cumulative degree days at Burlington Airport (>40 F) 3000 2500 2000 Cum. DD 1997 1500 1998 1999 1000 2000 500 0 April May June July 0 20 40 60 100 120 140 80 day after March
25 22.5 20 17.5 15 12.5 10 7.5 5 2.5 0 20 0 40 60 80 100 120 140 Sum precip. (in.) 1997 1998 1999 2000 April June May July day after March
1997 1998 1999 2000 65 60 55 warm & v. dry 50 PSNT ave. of last 90 samples (ppm) 45 40 35 cool & dry 30 cool & wet 25 warm & wet (after may) 20 15 5 10 15 20 25 30 5 10 15 20 25 June July
30 28 26 24 22 20 18 June July 16 15 20 25 30 5 10 15 1998 PSNT Moving average of 150 samples
1997 1998 1999 2000 Temperature cool warm warm cool Precipitation dry dry then v. dry wet wet after May Ave. PSNT 28 24 43 25
But, what happens if the climate shifts dramatically? • For example: • dry 8 very wet • cool and wet 8 warm and dry
If turns very wet just around sampling: Resample (if early enough)? Go to 2 ft? Suggest more N fertilizer than recommended by the PSNT? If turns very dry and warm: Resample (if early enough)? Suggest less N fertilizer than recommended by PSNT?
0 20 40 60 80 100 120 140 160 180 35 Site precipitation planting to PSNT All soils were sandy loams 30 25 6 in 9 in 20 Soil N03-N 0-30 cm (ppm) 9 in 15 16 in 10 5 0 Preplant Fertilizer N (kg/ha) PSNT values vs. preplant fertilizer N applications on four fields in Connecticut.
Recovery of preplant fertilizer as NO3-N Precip. 0 - 30 cm 30 - 60 cm 0 - 60cm Rel. yield PSNT (in) ----------------%----------------- 6 56.0 17.3 73.3 0.89 33 9 24.8 80.6 105.4 0.93 18 9 20.7 13.4 34.1 0.87 14 16 -1.3 5.0 3.7 0.62 6
PSNT and Cornell’s Dynamic Model • Routine Vermont PSNT soil tests and climate data (from one site) result in data that agrees with the results of Cornell’s dynamic N model. • Dry and warm spring climate result in high amounts of available N. • Dry and cool climate result in lower amounts of available N. • High rainfall in the critical period of N mineralization (and accumulation as NO3 ) can result in significant loss of N for crops. • Significant amounts of available N may still be in the root zone (but below 30 cm) following high rainfall on coarse texture soils.