Download
1 / 22
220 likes | 229 Vues
This project aims to develop a national model to forecast long distance passenger travel at the county level, allowing for the evaluation of alternative corridors and facilitating transportation planning. The model utilizes various datasets and networks to estimate trip generation, party size, trip distribution, and mode choice. It has been validated using AMTRAK and air ridership data and is designed to work with the Arkansas Statewide Model.

E N D
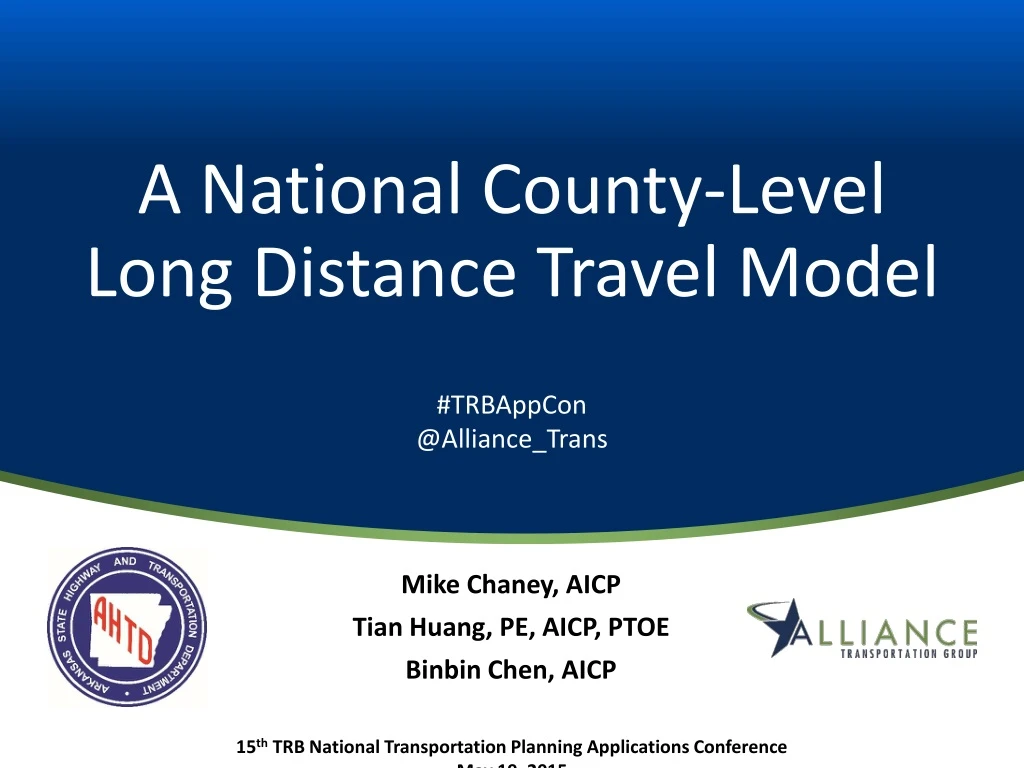
A National County-Level Long Distance Travel Model #TRBAppCon @Alliance_Trans Mike Chaney, AICP Tian Huang, PE, AICP, PTOE Binbin Chen, AICP 15th TRB National Transportation Planning Applications Conference May 19, 2015
Project Background • Feasibility of extending the South Central High Speed Rail Corridor from Little Rock to Memphis, and improving the passenger rail corridor between Little Rock and Texarkana • Alternatives • Two possible routes • Two levels of service (operating speed) alternatives • 79 mph • 110 mph
Team • Arkansas State Highway and Transportation Department (AHTD) • FRA grant • Alliance Transportation Group
Existing Tools • FRA CONNECT Model • MSA to MSA • TSAM by Virginia Tech • Four step model, at county level • Auto, commercial air, passenger rail • Texas Statewide Model (SAM) • 5 state version • Arkansas Statewide Model (AR TDM) • Auto, Urban rail & bus, Freight (rail, truck, water, air)
Future Tools • FHWA on-going efforts to model long distance travel • A National Model System to Forecast Long Distance Passenger Travel • Trips over 50 miles made by auto, air, rail or bus • AASHTO – National Travel Demand Forecasting Model • Phase I final scope - NCHRP report 8-36-70
Why Build a National County-Level Long Distance Model • No readily available tool • Data sources typically national • A national model allows for the evaluation of alternative corridors • It is reusable/transferable with little modification
Challenges in Building the Model • Long distance travel survey data • National datasets: • 1995 ATS • 2001 NHTS • 2009 NHTS • Networks • AMTRAK network • Air network • Intercity bus network • Schedule
Model Overview • Trip is defined as trips over 100 miles, travels within the lower 48 states • Zones: 3,076 counties in the lower 48 continental states of the US • Networks: • Highway network • Multimodal Transitnetworks • Air • AMTRAK • Intercity bus • Potential rail routes
Model Overview –Trip Generation • Trip purpose: • Business • Non-business • Trip rates: • Data source: 1995 ATS • By party size, household size, household income, and area type • 10.1 long distance person round trips per household annually • 22.8% business trips, 77.2% non-business trips
Model Overview – Party Size • Party Size Model: • Estimated from 1995 ATS for each trip purpose • Binary choice between travel alone or travel in group • Applied during trip generation
Model Overview – Trip Distribution • Gravity model • Impedance = Distance • Average trip length (miles)
Model Overview – Mode Choice • Alternatives: • Auto • Intercity rail • Intercity bus • High speed rail • Air • Level of service variables • In-vehicle time • Out-of-vehicle time • Cost
Validation Data • AMTRAK ridership • AMTRAK provided ridership relevant to the study corridor • AMTRAK fiscal year report • Air ridership • FAA domestic T-100 segment data • Comparison are made for: • System total • By route • By airport
Project Status • Stayed on Schedule • Submitted Ridership to FRA • Service Development Plan • Alternative Analysis • Highway Impacts
Works with Statewide Model • Designed to work Arkansas Statewide Model • Arkansas statewide model passenger trip purposes: • Short trip: less than 100 miles • Long distance trips: 100 miles or above, separated by business/non-business trips
Take Away • Easily transferable • Validated to AMTRAK ridership • Potential Enhancements: • Refine model when newer survey data is available • Add special generators for tourist oriented areas • Expand intercity bus network • Backcast to 1995
Thank you #TRBAppCon @Chaney_TX @Alliance_Trans Mike Chaney MChaney@emailATG.com