Download
1 / 25
420 likes | 1.26k Vues
Water Pollution. Cuyahoga River 1952. Sources of Pollution. Point sources = specific, identifiable sources of pollution factories, sewage treatment plants, mines, oil wells, oil tankers. Sources of Pollution.

E N D
Sources of Pollution • Point sources = specific, identifiable sources of pollution • factories, sewage treatment plants, mines, oil wells, oil tankers
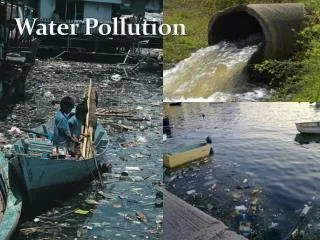
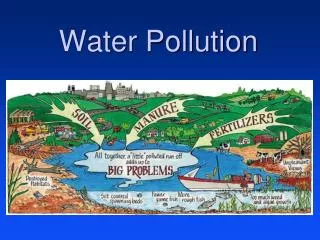
Sources of Pollution • Nonpoint sources = unidentifiable or multiple sources; cannot be traced to a single site of discharge • acid deposition, substances picked up in runoff, seepage into groundwater • Agriculture is largest source of water pollution in the U.S.
Types of Pollution • Infectious Agents • Oxygen Demanding Agents • Inorganic Chemicals • Organic Chemicals • Plant Nutrients • Sediment or Suspended Material • Radioactive Materials • Heat (Thermal Pollution)
Infectious Agents • Effects: Cause diseases • Examples: Bacteria, viruses, parasites, protozoa • Sources: Human & animal wastes
Inorganic Chemicals • Effects: add toxins to aquatic systems • Make water unusable for drinking/irrigation • Toxins can cause cancer, damage to nerves, liver, and kidneys • Examples: acids, salts, metal compounds • Sources: Industry, household cleaners, surface runoff
Organic Chemicals • Effects: add toxins to aquatic systems • Cause cancer, damage nervous and reproductive systems • Examples: oil, gasoline, plastics, pesticides, cleaning solutions • Sources: Industry, farms, households
Biological Magnification concentrations increase at increasing levels in the food chain – PCBs, DDT, etc.
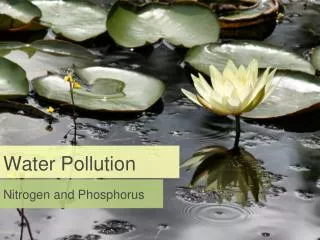
Plant Nutrients • Effects: excess growth of algae & other aquatic plants, leading to eutrophication • Examples: Nitrates (NO3) & phosphates (PO43-) • Sources: sewage, animal waste, inorganic fertilizers
Sediments • Effects: disrupts photosynthesis & food webs, carry harmful substances (pesticides, etc), clog & fill waterways, suffocate aquatic life • Examples: soil, silt • Sources: land erosion
Chesapeake Bay • This before/after shows just how much sediment, silt and mud was washed into the Chesapeake Bay by the recent storms. (NOAA) • http://www.wjla.com/blogs/weather/2011/09/chesapeake-bay-choked-with-sediment-after-recent-floods-map--12796.html
Chesapeake Bay • That scene, captured on Sept. 11 by NASA's Aqua satellite, came two days after heavy rain caused the third highest flooding on the Susquehanna River in recorded history (a peak river discharge of 778,000 cubic feet per second, FYI). Some sectors of the D.C. area got an astounding 32 inches of rain in the past two weeks. September 14, 2011 http://www.wjla.com/blogs/weather/2011/09/chesapeake-bay-choked-with-sediment-after-recent-floods-map--12796.html
Chesapeake Bay September 14, 2011 • Plumes of sediment were observed flowing down the Susquehanna River into the Chesapeake Bay this week after the remnants of Tropical Storm Lee brought heavy rainfall to Pennsylvania and Maryland. The large rainfall totals caused rivers to swell, washing dirt and pollution off the land and carrying it downstream to the Bay. Record flooding and water levels were recorded at Conowingo Dam on the Susquehanna River last week. http://www.chesapeakebay.net/blog/post/satellite_image_shows_sediment_pollution_flowing_into_chesapeake_bay
Chesapeake Bay • Satellite Image of Bay After Rain Storm Reveals Sediment Pollution • This NASA satellite image was taken on March 17 after a heavy downpour. It shows a plume of muddy water extending from the Susquehanna River, at the extreme northern end of the Bay, and flowing far south, almost to the Virginia border. 03/29/2011 http://cbf.typepad.com/bay_daily/2011/03/satellite-image-of-bay-after-rain-storm-reveals-sediment-pollution.html
Katrina – wingo?? • 174 million tons of muck • Once the basin fills, the U.S. Geological Survey projects a 250 percent increase of sediment, a 30 percent to 40 percent increase in phosphorous, and a 2 percent increase in nitrogen moving into the bay. Absent a Katrina-wingo-type event, we have 15 to 20 years before the basin fills http://www.ydr.com/opinion/ci_13324749
Katrina – wingo?? What's in the muck? • The Susquehanna River Basin Commission compiled a report in 2006 on sediment core samples analyzed by the U.S. Geological Survey and other agencies. Notable findings: • Coal is a major component. • Various levels of toxic metals • high concentrations of silver in lower levels of sediment. • The river appears to be the main source of PCBs to the upper bay, while pesticides appear to be trapped behind the dams. • Other components: • Methane gas. • Phosphorus. • Antibiotic-resistant bacteria. • Low levels of radiation. http://www.ydr.com/opinion/ci_13324749
Thermal (heat) • Effects: lowers dissolved oxygen in water, makes organisms more vulnerable to disease • Examples: excessive heat • Sources: electric power & industrial plants
Radioactive Materials • Effects: genetic mutations, miscarriages, birth defects, cancer • Examples: radioactive isotopes of iodine, radon, uranium • Sources: nuclear power plants, mining
Oxygen Demanding Wastes • Effects: Deplete dissolved oxygen • Examples: Biodegradable animal wastes and plant debris • Sources: sewage, animal feedlots, food processing facilities, pulp mills
Pollution – oxygen demanding agents • Biological Oxygen Demand (BOD): the amount of dissolved oxygen needed by aerobic bacteria to break down organic materials in a certain volume of water over a 5-day incubation period at 20°C (68°F) • Oxygen is removed from water when organic matter is consumed by bacteria. • Low oxygen conditions may kill fish and other organisms
Water Quality • A fecal coliform bacteria test is used to indicate the likely presence of disease-causing bacteria in water.
Other Water Quality Tests • Temperature & pH • Turbidity/Cloudiness • pH • Dissolved Oxygen (DO) • Nitrate/Nitrogen • Phosphate • Hardness • Salinity • Carbon Dioxide • Biotic survey (macro invertebrates)