Download
1 / 35
350 likes | 545 Vues
Oil & Gas Production The Future is Bright. Tim Carr Kansas Geological Survey and University of Kansas Energy Research Center. Where I Am Coming From:. Oil & Gas Background Geologist & Geophysicist Enhanced Recovery Technological Approach Energy is the Basis of Civilization

E N D
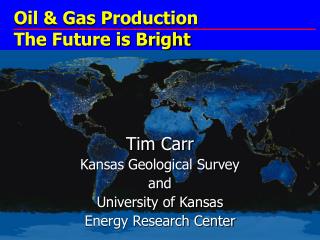
Oil & Gas Production The Future is Bright Tim Carr Kansas Geological Survey and University of Kansas Energy Research Center
Where I Am Coming From: • Oil & Gas Background • Geologist & Geophysicist • Enhanced Recovery • Technological Approach • Energy is the Basis of Civilization • Resource is Adequate • Insufficient Investment • Geopolitical Questions • Can Provide Energy & Protect the Environment • Hydrocarbons Are Our Major Energy Source Through the Middle of this Century
A Barrel of Crude Provides: Gasoline - 19.5 gallons One Barrel = 42 gallons Fuel Oil - 9.2 gallons Jet Fuel - 4.1 gallons Asphalt - 2.3 gallons Kerosene - 0.2 gallons Lubricants - 0.5 gallons Petrochemicals, other products - 6.2 gallons American Petroleum Institute, 1999
Overview • Resource • Forecast and Price Trends • Changes in H/C Ratio • Future is NOT a Bell Curve • Future Production Requires Investment • 50% Per Decade • Technology and People • Investment • Geopolitics (Access) • Environment In 2004 Economic Growth at 15 Year High China’s Oil Consumption is increased 15%, 900,000 b/d World Oil Consumption Increased 2.5 million b/d
U.S. Primary Energy Consumption by Fuel, 1960-2030 (quadrillion Btu) History Projections Coal Natural Gas Petroleum Nuclear Renewables Annual Energy Outlook 2006
U.S. Primary Energy Consumption by Fuel, 1960-2030 (Billions of Barrels of Oil Equivalent) History Projections Coal Natural Gas Petroleum Nuclear Renewables Annual Energy Outlook 2006
Energy Usage: 1750-2000 ? An Energy Dependent Civilization Internet Micro-processor Environmental issues Modifiers Satellite WWII WWI Telecommunications Energy Usage Living standards Coal Steam Steam locomotive Power stations Air travel Population growth Global markets Internal combustion engine Drivers 1750 1800 1850 1900 1950 2000 Cook and Sheath, 1997
Projected World Oil Supplies 43.4 Bbo/yr 2025 37.6 Bbo/yr 2015 28.5 Bbo/yr 2002 Geologically-determined peak could have consequences up to and including “war, starvation, economic recession, even the extinction of homo sapiens” (Campbell in Ruppert 2002). “Civilization as we know it is coming to an end soon. This is not the wacky proclamation of a doomsday cult, apocalypse bible prophecy sect, or conspiracy theory society. Rather, it is the scientific conclusion of the best paid, most widely-respected geologists, physicists and investment bankers in the world.”
Projected World Oil Supplies 28.5 Bbo/yr 2002 A successful oilman remarked “I would never hire an exploration geologist who is not an optimist, or a petroleum engineer who is not a pessimist.” “There are 195 deepwater fields slated for development from 2005 to 2009 with a total of 37,279 MMBOE” “If past history was all there as … the richest people would be librarians” (Warren Buffet) Laherre’re, 2000
Projected World Energy Supplies Hydroelectric Hydroelectric 1993 100 100 100 BILLION Solar , W ind BARRELS Geothermal New Technologies 80 80 World Energy Demand Billion Billion Barrels Barrels Nuclear Electric Coal Coal of Oil of Oil 60 60 Equivalent Equivalent per Y ear per Y ear Natural Natural (GBOE) (GBOE) Gas Gas 40 40 Decreasing Fossil Fuels Crude Oil Crude Oil 20 20 1900 1920 1940 1960 1980 2000 2020 2040 2060 2080 3000 1900 1920 1940 1960 1980 2000 2020 2040 2060 2080 3000 after Edwards, AAPG 8/97
Supply & Technology Cumulative Production Proved Reserves Reserves Reserve Growth INCREASING Development costs Technology needs Uncertainty DECREASING Concentration Undiscovered, Unconventional Reserves Unassessed Unconventional Reserves Geopressured Brine Not Assessed by NPC Gas Hydrates EIA, 2005 Data: Natural Gas (NPC, 1999) 1,451 Recoverable Portion of In-Place Gas Resource (Tcf)
Oil Reserves-to-Production (R/P) Ratios BP Statistical Review of Energy, 2005
Natural Gas Reserves-to-Production BP Statistical Review of Energy, 2005
Oil and Gas Requires Investment Catch – About 50% of the daily volume in 10 years is not online. At present, requires approximately $100 billion a year.
Oil Refinery Utilization BP Statistical Review of Energy, 2005
Evolution of Technology Available Expertise Geopolitics Access Investment Climate Price Requirements to Meet Demand Today, 1.6 billion people –one quarter of the world population have no access to electricity. In 2030, 1.4 billion people 17% of the world population will still not have electricity. 2.4 billion people rely on traditional biomass – wood, agricultural residues and dung – for cooking and heating.
Technical Challenges WHO estimates that 2.5 million women and young children die prematurely each year from fumes from biomass stoves. Shifting to LPG reduces health risk by > 100 In sub-Saharan Africa only half the population has access to an improved water source (energy for pumps and purification) In India, up to seven hours a day are devoted to collecting fuel for cooking. • Greater Depths • Deeper Water • Decreasing Quality • Reservoir • Hydrocarbon • Distance to Market • Price
Energy Production is High-Tech Science Jed Clampett also does not exist • Multiple Discipline Professionals evaluate “Mountains” of data to maximize reservoir recovery. • The extraction process is based primarily on • management of the pressure and fluids • placement of wells to maximize efficiency. • Historically, • Traditional “pumping” technologies extracted 20 percent of hydrocarbons in a reservoir • New Computer Models and technologies improve recovery to greater than 35 percent (75% Goal). • This Science Continues to Improve with new breakthroughs
Data Models for Energy Recovery • Data Models are collected utilizing seismic readings. • Computer Models are put in place to view these readings in a 3D Model • Data is collected over time intervals for a 4D view of the data and changes over time • Data sets are in Terabyte range with future projections in Petabyte range as information improves View of 3D Seismic Data
Key Technologies Deep-water, Sub-sea, FPSO Horizontal Drilling, Geosteering, & Rotary Steering Systems 3D Seismic, Computer Assisted Exploration Source: Bates, 2002, GCAGS Baker Hughes
Oil Sands - In Situ Deposits SAGD Process Oil Production Steam Chamber Steam Injection Oil Production Reservoir • 80% of resource in situ • too deep to mine • current in situ production of 325,000 b/d bitumen + diluent for pipeline • new technology developments: • cyclic steam stimulation • Steam Assisted Gravity drainage (SAGD) • VAPEX, MSAR Steam Injection Source: PetroCanada
Oil Sand Cost Trends Revolutionary Evolutionary Oil & Gas Journal 7/28/2003.
Same View in 1991 Environmental Impact Tarr Farm, Pennsylvania 1862
How much of change is natural versus mankind’s use of fossil fuels? Atmospheric Concentration of CO2 1000 Year History 380 D57 D47 Siple South Pole 360 340 Concentration of CO2 PPM 320 300 280 260 800 1000 1200 1400 1600 1800 2000 Years Cook and Sheath, 1997
CO2 Emissions – Real Issue Economic Model Projections of Global CO2 Emissions (No Kyoto) Other Mideast & OPEC India China Canada Australia, NZ Russia & EE W. Europe USA Japan 1990 2050 2100
Geopolitics and Atlantic Gas Access Anticosti Basin St. John’s Magdalen Basin SOEI ~ 500 MMcf/d Halifax Deep Panuke 400 MMcf/d – 2005 Scotian Basin Boston
Geopolitical Decision: Restricted Access to Gas Resource Base 21 TCF 346 TCF 40% 100% 31 TCF 100% RestrictedPercentage 43 TCF 56% Approximately 29 trillion cubic feet (TCF) of the Rockies gas resources are closed to development and 108 TCF are available with restrictions.
Urban Legends (Energy) • CONVENTIONAL OIL & GAS NEAR A PEAK • TAR SANDS AND OTHER UNCONVENTIONAL RESOURCES ARE TOO DIRTY OR COSTLY TO BE PRODUCED • ENERGY OUTPUT FROM ETHANOL IS NEGATIVE • EVIRONMENTAL IMPACT FROM OIL AND GAS PRODUCTION AND USE CAN NOT BE MITIGATED • EASY OIL IS GONE, COSTS ARE RISING • GEOLOGISTS ARE YOUNG AND HANDSOME
“…. you must in the first place realize this that the world has now grown old and does not abide in that strength in which it formerly stood. …. Less and less marble is quarried out of the mountains, and veins of gold and silver are dwindling day by day…… So no one should wonder nowadays that everything begins to fail, since the whole world is failing, and is about to die.” St. Augustine 3th Century Quoted in: St. Augustine Rebecca West, 1933, p.159 Eastern Montana, 1978