Download
1 / 18
180 likes | 369 Vues
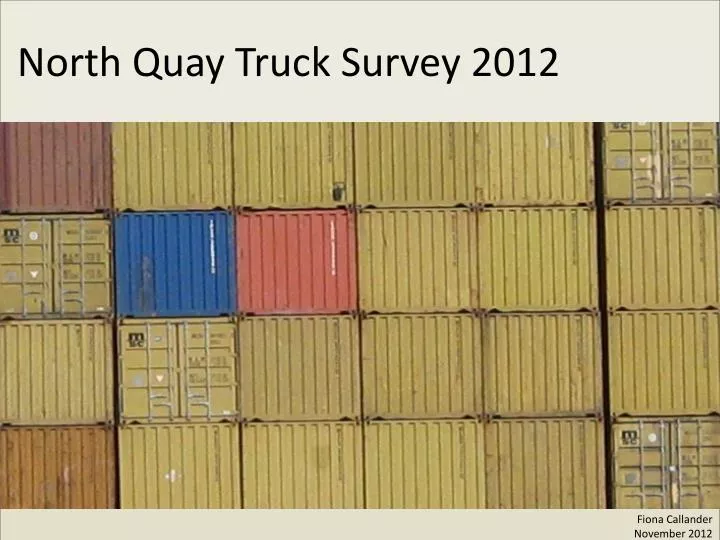
North Quay Truck Survey 2012. Fiona Callander November 2012. Objectives. Support government plans to stabilise truck numbers Annual road-based survey to monitor: Container truck numbers Proportion of container trucks in traffic flow Container truck types Container truck loading

E N D
North Quay Truck Survey 2012 Fiona Callander November 2012
Objectives Support government plans to stabilise truck numbers Annual road-based survey to monitor: Container truck numbers Proportion of container trucks in traffic flow Container truck types Container truck loading 11th annual survey Fiona Callander November 2012
Two survey points, capturing all container traffic • Data collected over two consecutive weeks • week 1 : 10th to 14th September • week 2 : 17th to 21st September • Survey carried out over 18 hours, 0500 to 2300hrs • Week 1 – all vehicles recorded • Week 2 – only container trucks recorded • Trucks classified by cargo and axle configuration • Number and size of containers carried recorded • Lifting capability noted Port Beach Rd site Method Tydeman Rd site Fiona Callander November 2012
Tydeman Rd How much traffic is there? 11% of all vehicles are now container trucks. In 2002, this figure was 5% Port Beach Rd 2% of all vehicles are now container trucks. In 2002, this figure was 1% Fiona Callander November 2012
Trade increased by average of 7% pa 2002 to 2012 Truck numbers increased by average of 5% pa 2002 to 2012 How many container trucks per day? 2002 2009 2010 2012 Fiona Callander November 2012
How did this vary over the survey period? Week 1 Week 2 Fiona Callander November 2012
How does this vary over the course of the day? 23% of trucks appear before 9am 74% of trucks appear before 3pm 93% of trucks appear before 6pm Fiona Callander November 2012
Unladen trucks on Tydeman Road 33% of container trucks on Tydeman Road are unladen (36% inbound and 29% outbound) This equates to 740 trucks every 18hr weekday Fiona Callander November 2012
Unladen trucks on Port Beach Road 12% of container trucks on Port Beach Road are unladen (14% inbound and 9% outbound) This equates to 33 trucks every 18hr weekday Fiona Callander November 2012
How has empty running been changing? Empty running fell from 29% in 2002 to 24% in 2006 but has risen to 30% in 2012 over a 12 hour day This is the highest level observed since the survey began Fiona Callander November 2012
How many TEU does each truck carry? Empty trucks and those with 1 TEU carry only 13% of the TEU task but represent 48% of all trucks The remaining 52% of trucks carry 87% of the TEU task Fiona Callander November 2012
How has this been changing over time? • Empty running has trended up • The proportion carrying only 1TEU has fallen over time • The proportion carrying 2 TEU has been fairly steady • The proportion carrying 3 or 4 TEU has risen to 2007 but then has been reducing slightly Fiona Callander November 2012
What type of truck is servicing the trade? The truck fleet is dominated by 6-axle semi-trailers Fiona Callander November 2012
What are these types of truck carrying? Fiona Callander November 2012
How has truck loading been changing? TEU per truck has fallen for the third year in a row Fiona Callander November 2012
Overall trends since 2002 Good News: Truck Growth has not matched trade growth over time Bad News: Truck numbers are trending upwards along with the road based TEU task Truck productivity (TEU/truck) therefore shows little or no improvement over time Fiona Callander November 2012
12,650 container trucks observed during average survey week • These trucks carried a total of 16,260 TEU • 11,300 container trucks observed last year carrying a total of 15,030 TEU. • 12% increase in trucks but only an 8% increase in TEU task from Aug 2011 to Sep 2012 • These figures demonstrate lower truck productivity in 2012. • The figures for TEU carried tie in well with the 9% cross-wharf trade increase in the 2012 financial year. Summary – road based container task Fiona Callander November 2012
First year of observing 18hrs confirmed early start and some activity in late evening • Empty running still stubbornly high • Decreased productivity • Too many small trucks – low productivity in terms of both capacity and loading • More two way loading required Summary – truck loading Fiona Callander November 2012