Download
1 / 37
370 likes | 440 Vues
Discover the groundbreaking research on heavy rainfall patterns in the Southeast USA presented by Jim O'Brien and team at Florida State University. This study introduces a new scale to assess heavy rainfall events, providing valuable insights for water utility managers, stormwater control engineers, and agricultural specialists. Dive into the complex world of rainfall statistics, with data on rainfall probability, exceedance probabilities by month, and seasonal rainfall forecasts. Gain a deeper understanding of extreme weather events such as hurricanes and tornadoes, and their impact on the region. Explore the innovative approach of fitting rainfall events to a Gamma distribution, shedding light on the potential for flooding and infrastructure planning. Stay ahead of the curve with the latest research in climate science and weather prediction. Join us in unravelling the mysteries of rain - the key to understanding environmental dynamics in the Southeastern USA.

E N D
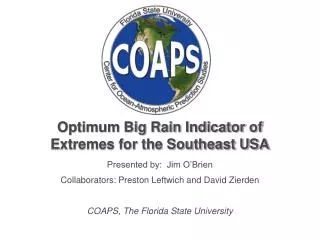
Optimum Big Rain Indicator of Extremes for the Southeast USA Presented by: Jim O’Brien Collaborators: Preston Leftwich and David Zierden COAPS, The Florida State University
Hurricanes and Tornadoes are Categorical Hurricanes Saffir-Simpson Scale CategoryWind Speed Cat 1 74-95 mph Cat 2 96-110 mph Cat 3 111-130 mph Cat 4 131-155 mph Cat 5 > 155 mph Tornadoes Enhanced Fujita Scale CategoryWind Speed EF0 65-85 mph EF1 86-110 mph EF2 111-135 mph EF3 136-165 mph EF4 166-200 mph EF5 > 200 mph Both scales are based on damage potential.
Gamma Distribution Alpha > 1.0 Gamma Function Generalized Gamma pdf Alpha < 1.0
Potential Applied Users • Water utility managers • Water management districts • Stormwater design and control • Engineering (retention pond design and maintenance) • Road and other construction • Agricultural specialists • Flooding potential outlooks • Wildcard – human health
Proposed Scale for Heavy Rainfall Heavy Rainfall Event (2-day) CategoryAmountProbability R1 1-2 inches 80-88% R2 2-2.5 inches 88-96% R3 2.5-3 inches 96-99% R4 > 3 inches > 99%
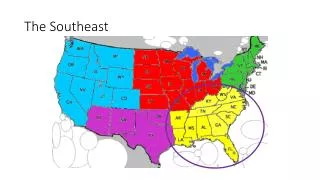
Station Distribution Map • Heavy rain events based on 2-day totals. • NWS Cooperative Observers only report once daily, usually midnight-to-midnight. • Rainfall does not automatically stop at midnight, 2-day totals better describe discrete events. • In some cases, 3-day totals may be applicable
Exceedance Probabilities by Month Tarpon Springs, FL March Category 2 Rainfall Event
Exceedance Probabilities by Month Tarpon Springs, FL April Category 2 Rainfall Event
Exceedence Probabilities by ENSO Phase Tarpon Springs, March Tarpon Springs, July
Seasonal Probability by 20-year periods Orlando, FL Probability of at least one Cat 2 Rainfall Event (2 inches or greater)
Seasonal Probability by 20-year periods High Springs, FL Probability of at least one Cat 2 Rainfall Event (2 inches or greater)
Southeastern Rainfall Extremes Dr. James J. O’Brien July 10, 2012 AASC Annual Meeting in Sandestin
The End www.coaps.fsu.edu
Black: Empirical Red: Exponential Green: Gamma (max liklihood) Blue: Gamma (Method of Moments) Purple: Gamma (Method of Moments via L-moments)