Operations Management Waiting Lines
Operations Management Waiting Lines. Objectives. Understanding the phenomenon of waiting Measures of waiting-line systems Waiting time, number of waiting orders Impact of variability/uncertainty & utilization rate Risk pooling effect in waiting line. The Article.

Operations Management Waiting Lines
E N D
Presentation Transcript
Objectives • Understanding the phenomenon of waiting • Measures of waiting-line systems • Waiting time, number of waiting orders • Impact of variability/uncertainty & utilization rate • Risk pooling effect in waiting line
The Article • The Psychology of Waiting Lines • About experience of waiting • Actual waiting time versus waiting time that feels like • Laws of service • Satisfaction = Perception – Expectation • It is hard to play catch-up ball
Principals of Waiting • Unoccupied time feels longer than occupied time • Pre-process waits feels longer than in-process waits • Anxiety makes waits seem longer • Uncertain waits are longer than known, finite waits • Unexplained waits are longer than explained waits • Unfair waits are longer than equitable waits • The more valuable the service, the longer I will wait • Solo waiting feels longer than group waiting
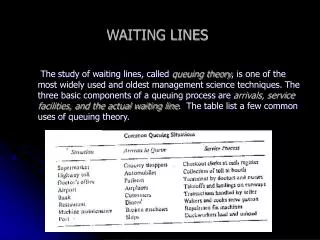
Characteristics of Queuing Systems • The time of the arrival of an order is not known ahead of time • The time a telephone call is made is random • The service time is not known ahead of time • The time a customers spends on the web page of Amazon.com is random • The time a customer spends speaking with the teller in the bank is unknown
Characteristics of Queuing Systems • This leads to: • Idleness of resources • Waiting time of customers (orders) to be processed • We are interested in evaluating: • Average waiting time in the queue and in the system • The average number of orders (customers) waiting to be processed • Waiting time and average number are measures
Characteristics of Queuing Systems • This leads to: • Idleness of resources • Waiting time of customers (orders) to be processed • We are interested in evaluating: • Average waiting time in the queue and in the system • The average number of orders (customers) waiting to be processed • Waiting time and average number are measures
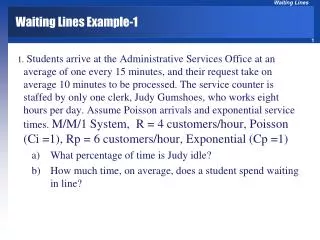
A Deterministic System: Example 1 • Questions: • Can we process the orders? • How many orders will wait in the queue? • How long will orders wait in the queue? • What is the utilization rate of the facility?
Utilization • Arrival rate = 1/10 per minutes • Processing rate = time 1/9 per minute • Utilization – AR/PR = (1/10)/(1/9) = 0.9 or 90% • On average 0.9 person is in the system
Known but Uneven Demand: Example 2 • What if arrivals are not exactly every 10 minutes? • Let’s open the spreadsheet.
A Deterministic System: Example 2 Observations: • Utilization is below 100% (machine is idle 14% of the time). • There are 1.12 orders (on average) waiting to be processed.
A Deterministic System: Example 2 • Why do we have idleness (low utilization) and at the same time orders are waiting to be processed? • Answer: Variability
Known but Uneven Demand: Example 2 • How to measure variability? • Coefficient of variation: CV = Standard Deviation / Mean
Uncertain Demand (Interarrival times): Example 3 • The interarrival time is either 5 periods with probability 0.5 or 15 periods with probability 0.5 • Notice that the mean interarrival time is 10. (mean interarrival = 0.5 * 15 + 0.5 * 5 = 10) • The service time is 9 periods (with certainty). • The only difference between example 3 and 1 is that the interarrival times are random.
Simulation of Uncertain Demand (Inter-arrival times): Example 3
Uncertain Demand (Interarrival times): Example 3 (Recall that in Example 1, no job needed to wait.)
Uncertain Demand (Inter-arrival times): Example 3 • Suppose we change the previous example and assume: • Inter-arrival time 17 0.5 probability • Inter-arrival time 3 0.5 probability • Average inter-arrival times as before 10 min.
Uncertain Demand (Interarrival times): Example 3 The effect of variability: higher variability in inter-arrival times results in higher average # in queue.
Can we reduce demand variability/uncertainty? • Can we manage demand? • What are other sources of variability/uncertainty?
Uncertain Demand (Inter-arrival times) • Up to now, our service time is exactly 9 minutes. • What will happen to waiting-line and waiting-time if we have a short service time (i.e., we have a lower utilization rate)? • What will happen if our service time is longer than 10 minutes?
Key Concepts and Issues • The factors that determine the performance of the waiting lines: • Variability • Utilization rate • Risk pooling effect
Rule 1 • In general, if the variability, or the uncertainty, of the demand (arrival) or service process is large, the queue length and the waiting time are also large.
Rule 2 • As the utilization increases the waiting time and the number of orders in the queue increases exponentially.
Rule 3 • In general, pooling the demand (customers) into one common line improves the performance of the system.