Management of Waiting Lines
330 likes | 759 Vues
Waiting Lines. Waiting lines occur in all sorts of systemsWait time is non-value addedWait time range from the acceptable to the emergentShort waits in a drive-thruSitting in an airport waiting for a delayed flightWaiting for emergency service personnelWaiting time costsLower productivityRed

Management of Waiting Lines
E N D
Presentation Transcript
1. Chapter 18 Management of Waiting Lines
2. Waiting Lines Waiting lines occur in all sorts of systems
Wait time is non-value added
Wait time range from the acceptable to the emergent
Short waits in a drive-thru
Sitting in an airport waiting for a delayed flight
Waiting for emergency service personnel
Waiting time costs
Lower productivity
Reduced competitiveness
Wasted resources
Diminished quality of life
3. Queuing Theory Queuing theory
Mathematical approach to the analysis of waiting lines
Applicable to many environments
Call centers
Banks
Post offices
Restaurants
Theme parks
Telecommunications systems
Traffic management
4. Why Is There Waiting? Waiting lines tend to form even when a system is not fully loaded
Variability
Arrival and service rates are variable
Services cannot be completed ahead of time and stored for later use
5. Waiting Lines: Managerial Implications Why waiting lines cause concern:
The cost to provide waiting space
A possible loss of business when customers leave the line before being served or refuse to wait at all
A possible loss of goodwill
A possible reduction in customer satisfaction
Resulting congestion may disrupt other business operations and/or customers
6. Waiting Line Management The goal of waiting line management is to minimize total costs:
Costs associated with customers waiting for service
Capacity cost
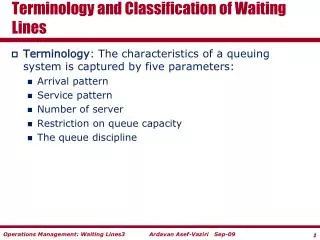
7. Waiting Line Characteristics The basic characteristics of waiting lines
Population source
Number of servers (channels)
Arrival and service patterns
Queue discipline
8. Simple Queuing System
9. Population Source Infinite source
Customer arrivals are unrestricted
The number of potential customers greatly exceeds system capacity
Finite source
The number of potential customers is limited
10. Channels and Phases Channel
A server in a service system
It is assumed that each channel can handle one customer at a time
Phases
The number of steps in a queuing system
11. Common Queuing Systems
12. Arrival and Service Patterns Arrival pattern
Most commonly used models assume the arrival rate can be described by the Poisson distribution
Arrivals per unit of time
Equivalently, interarrival times are assumed to follow the negative exponential distribution
The time between arrivals
Service pattern
Service times are frequently assumed to follow a negative exponential distribution
13. Poisson and Negative Exponential
14. Queue Discipline Queue discipline
The order in which customers are processed
Most commonly encountered rule is that service is provided on a first-come, first-served (FCFS) basis
Non FCFS applications do not treat all customer waiting costs as the same
15. Waiting Line Metrics Managers typically consider five measures when evaluating waiting line performance:
The average number of customers waiting (in line or in the system)
The average time customers wait (in line or in the system)
System utilization
The implied cost of a given level of capacity and its related waiting line
The probability that an arrival will have to wait
16. Queuing Models: Infinite Source Four basic infinite source models
All assume a Poisson arrival rate
Single server, exponential service time
Single server, constant service time
Multiple servers, exponential service time
Multiple priority service, exponential service time
17. Infinite-Source Symbols
18. Basic Relationships
19. Basic Relationships Little�s Law
For a stable system the average number of customers in line or in the system is equal to the average customers arrival rate multiplied by the average time in the line or system
20. Basic Relationships The average number of customers
Waiting in line for service:
In the system:
The average time customers are
Waiting in line for service
In the system
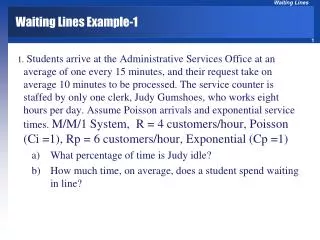
21. Single Server, Exponential Service Time M/M/1
22. Single Server, Constant Service Time M/D/1
If a system can reduce variability, it can shorten waiting lines noticeably
For, example, by making service time constant, the average number of customers waiting in line can be cut in half
Average time customers spend waiting in line is also cut by half.
Similar improvements can be made by smoothing arrival rates (such as by use of appointments)
23. Multiple Servers (M/M/S) Assumptions:
A Poisson arrival rate and exponential service time
Servers all work at the same average rate
Customers form a single waiting line (in order to maintain FCFS processing)
24. M/M/S
25. Cost Analysis Service system design reflects the desire of management to balance the cost of capacity with the expected cost of customers waiting in the system
Optimal capacity is one that minimizes the sum of customer waiting costs and capacity or server costs
26. Total Cost Curve
27. Maximum Line Length An issue that often arises in service system design is how much space should be allocated for waiting lines
The approximate line length, n, that will not be exceeded a specified percentage of the time can be determined using the following:
28. Multiple Priorities Multiple priority model
Customers are processes according to some measure of importance
Customers are assigned to one of several priority classes, according to some predetermined assignment method
Customers are then processed by class, highest class first
Within a class, customers are processed by FCFS
Exceptions occur only if a higher-priority customer arrives
That customer will be processed after the customer currently being processed
29. Finite-Source Model Appropriate for cases in which the calling population is limited to a relatively small number of potential calls
30. Constraint Management Managers may be able to reduce waiting lines by actively managing one or more system constraints:
Fixed short-term constraints
Facility size
Number of servers
Short-term capacity options
Use temporary workers
Shift demand
Standardize the service
Look for a bottleneck
31. Psychology of Waiting Steps can be taken to make waiting more acceptable to customers
Occupy them while they wait
In-flight snack
Have them fill out forms while they wait
Make the waiting environment more comfortable
Provide customers information concerning their wait