Download
1 / 22
230 likes | 409 Vues
Introduction to Population Pyramids. Dependency Ratio. The number of people who are too young or too old to work, compared to the number of people in their productive years . Dependency Ratio. 0-14 = Dependents 15-64 = Workers 64+ = Dependents DR = Number of Dependents (0-15 and 65+)

E N D
Dependency Ratio • The number of people who are too young or too old to work, compared to the number of people in their productive years
Dependency Ratio • 0-14 = Dependents • 15-64 = Workers • 64+ = Dependents • DR = Number of Dependents (0-15 and 65+) Number of Working-age (16-64) X 100
Population under the age of 15 - usually shown as a percentage of the total population of a country - dependency age is 0-15
Sex Ratio • Sex Ratio: number of males per hundred females • In general more males are born than females • Males have higher death rates • Examples: • Europe and North America = 95:100 • Rest of World = 102:100
Sex Ratio – Developing Countries • Have large % of young people –where males generally outnumber females • Lower % of older people – where females are typically more numerous • High immigration = more males
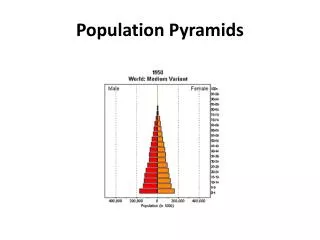
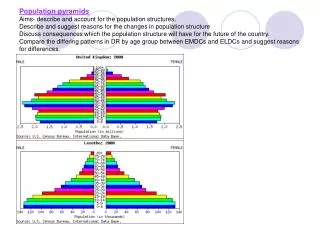
Population Pyramids • A country’s stage in Demographic Transition gives it a distinctive population structure • Also called Age-Sex Pyramids
THE POWER OF THE PYRAMID - A POPULATION PYRAMID is a graphic device that allows Demographers to look at how events affect populations of countries. - What are the ages of the people? - How many are men? - How many are women? -Graphs show a breakdown of a country’s population and how economic, political, and natural events over 70 – 80 years can impact different age groups. The graphs can help predict future population tends.
Population Pyramids – Graphs that show the percentages of each age group in the total population, divided by gender. For poorer countries, the chart is shaped like a pyramid. Infant mortality rates are high, life expectancy is shorter.
A typical example of a high birth rate and high death rate pyramid. Life expectancy is low.
China’s pyramid shows the results of the single child policy.
The US pyramid shows the results of the baby boom (1946-66) and maybe the “baby bounce” 25-30 years later
Population Pyramid • Population composition on graph: • Males = left side of the vertical axis • Females = right side of the vertical axis • Age = order sequentially with youngest at the bottom and oldest at the top (usually by five-year cohorts)
Rapid Growth • A country in stage 2 of the Demographic Transition Model • Large number of young people and a smaller older population
Slow Growth • A country in stage 4 of the Demographic Transition Model • Large number of “older people” • Smaller % of young people
No Growth • End of stage 4, entering Stage 5 • Large number of “older people” • Very small % of young people
Developing Relatively Developed Developed (poor) (rich) What stage goes with each pyramid?