Download

1 / 59
590 likes | 783 Vues
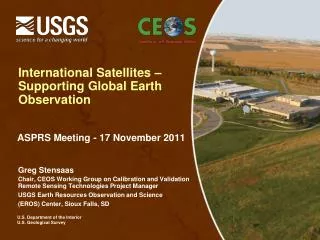
Remote Sensing Meteorological Satellites Applied to Earth Surface Observation. Meteorological Satellites (Metsats). Coarse spatial resolution, high temporal resolution NOAA, GOES, and DMSP NIMBUS EOS, OrbView-2, SPOT-4. 1. AVHRR. Advanced Very High Resolution Radiometer 1979 –

E N D
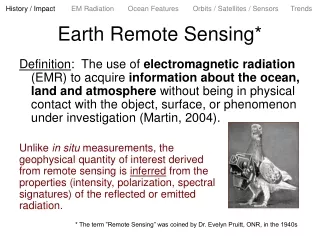
Remote SensingMeteorological Satellites Applied to Earth Surface Observation
Meteorological Satellites (Metsats) • Coarse spatial resolution, high temporal resolution • NOAA, GOES, and DMSP • NIMBUS • EOS, OrbView-2, SPOT-4
1. AVHRR • Advanced Very High Resolution Radiometer • 1979 – • Designed as weather sensors on NOAA satellites • Become increasingly popular for land oriented applications http://www.crisp.nus.edu.sg/~research/tutorial/spacebrn.htm
AVHRR Orbits • Sun-synchronous • Inclination 98.9o • 833km altitude • Swath 2400km cross track
June 26, 2000 covers European Russian eastward into Siberia. East Coast on September 27, 1997: http://rst.gsfc.nasa.gov/Sect14/Sect14_6.html http://rst.gsfc.nasa.gov/Sect14/Sect14_6.html
Spectral Resolution • - band1: 0.58-0.68microm (red) - band2: 0.72-1.10microm (near infrared) - band3: 3.55-3.93microm (mid infrared- thermal) - band4: 10.30-11.3microm (thermal)* - band5: 11.50-12.5microm (thermal)*
Resolutions • 10 bits, 1024 levels of brightness • Spatial resolution - 1.1km Local Area Coverage (LAC) - 4 km global Area Coverage (GAC) • Temporal resolution: daily
Data • Low cost • Public domain distributed by NOAA
Vegetation Indices • Vegetation Index (VI): NIR-Red • Normalized difference vegetation index (NDVI) NDVI = (NIR-Red)/(NIR+Red)
NDVI AVHRR http://glcf.umiacs.umd.edu/data/gimms/
NDVI MODIS https://lpdaac.usgs.gov/products/modis_products_table/mod13c2
NDVI SPOT http://www.spot-vegetation.com/pages/policy.html
Vegetation Index http://rst.gsfc.nasa.gov/Sect3/Sect3_4.html
2. GOES • Geostationary Operational Environmental Satellites • As part of global network of metsats 70o longitude apart around the world, domestic data available since 1975 • Geosynchronous, altitude 36,000km • GOES East 75oW, GOES-West 135oW
GOES East 75oW http://www.goes.noaa.gov/ECIR4.html
GOES-West 135oW http://www.goes.noaa.gov/WCIR4.html
GOES .. • A full disk view • A visible (day time) 0.55-0.70microm 4 thermal band (day and night) 3.8-12.5microm • 1km spatial resolution for the visible band, and 4,8,4,4km for the four thermal bands, respectively • Data are distributed real time
GOES View of South America http://rst.gsfc.nasa.gov/Sect14/Sect14_7.html
3. DMSP • Defense Meteorological Satellite Program • Data were available to civilian users since 1973 http://www.crisp.nus.edu.sg/~research/tutorial/dmsp.htm
3. DMSP • Sun-synchronous • 0.4-1.1microm (visible & NIR), 8-13microm (thermal) • A nighttime visible band, the population map, volcanoes, oil and gas fields, and forest fires • 3km spatial resolution
4. Ocean Monitoring Satellites • Nimbus-7, 1978 – 1986 • Carry Coastal Zone Color Scanner (CZCS) • Swath 1566km Thermal Visible The Gulf of Mexico http://rst.gsfc.nasa.gov/Sect14/Sect14_4.html
4. NIMBUS • 825m spatial resolution • 6 bands - visible bands: phytoplankton concentration, suspended silt - NIR: surface vegetation, land/water boundary - thermal: sea surface temperature
Color-coded temperature maps http://rst.gsfc.nasa.gov/Sect14/Sect14_4.html
5. Earth Observing System (EOS) • Earth Science Enterprise (ESE) formally called Mission to Planet Earth (MTPE) NASA program • Terra (EOS-AM), 1999 Aqua (EOS-PM), 2002
Terra http://rst.gsfc.nasa.gov/Sect16/Sect16_7.html
Five Sensors on Board Terra • MODIS - Moderate Resolution Imaging Spectro-Radiometer • ASTER - Advanced Spaceborne Thermal Emission and Reflection Radiometer • CERES - Clouds and the Earth’s Radiant Energy System • MISR - Multi-Angle Imaging Spectro-Radiometer • MOPITT - Measurements of Pollution in the Troposphere
MODIS http://rst.gsfc.nasa.gov/Sect16/Sect16_7.html • MODIS, a highly improved successor to AVHRR • Launched in 1999 • Greater spatial resolution, 250, 500, and 1000m • 36 bands between 0.405-14.385mm • 4096 radiometric resolution • 2-day interval
MODIS Bands • Bands 1-2 0.62-0.876mm, 250m, Land/clouds boundaries • Bands 3-7 0.459-2.155mm, 500m, Land/cloud properties • Bands 8-16 0.405-0.877mm, 1000m, Ocean color /phytoplankton/biogeochemistry • Bands 17-19 0.890-0.965mm, 1000m, Atmospheric water vapor
MODIS Bands … • Bands 20-23 3.660-4.080mm, 1000m, Surface/cloud temperature • Bands 24-25 4.433-4.549mm, 1000m, Atmospheric temperature • Band 26 1.360-1.390mm, 1000m, Cirrus clouds • Bands 27-29 6.538-8.700mm, 1000m, Water vapor
MODIS Bands … • Band 30 9.580-9.880mm, 1000m, Ozone • Bands 31-32 10.780-12.270mm, 1000m, Surface/cloud temperature • Bands 33-36 13.185-14.385mm, 1000m, Cloud top altitude
A MODIS oblique view One of the important EOS joint study programs is the Indian Ocean Experiment. http://rst.gsfc.nasa.gov/Sect16/Sect16_9.html
MODIS Atmospheric appearance of aerosols, much being the result of pollution Water vapor, even when heavy clouds are absent or dispersed http://rst.gsfc.nasa.gov/Sect16/Sect16_9.html
MODIS The chlorophyll content The fluorescent properties of the ocean, which relate to plankton content. http://rst.gsfc.nasa.gov/Sect16/Sect16_9.html
ASTER • Collaboration between US and Japan • Consists of three instrument systems VNIR: visible and NIR SWIR: short wave infrared TIR: thermal infrared • 60km swath http://rst.gsfc.nasa.gov/Sect16/Sect16_7.html
ASTER • VNIR: visible and NIR G, R, NIR, NIR; 15m, 8bits • SWIR: short wave infrared 5 bands in MIR; 30m, 8bits • TIR: thermal infrared 5 bands in thermal; 90m, 12bits http://rst.gsfc.nasa.gov/Sect16/Sect16_7.html
ASTER Volcanoes in the Andes mountain chain of South America http://rst.gsfc.nasa.gov/Intro/Part2_26.html
Multispectral imaging contributions to global land ice measurements from space Examples of ASTER RGB false-color composites draped over ASTER DTMs. (A) Tasman Glacier, New Zealand. The scene covers approximately 25 x 25 km (B) Llewellyn Glacier, British Columbia. Scale is ∼13 km across the middle of the image and 25 km from bottom (foreground) to top (background). 15m resolution. Kargel, J. S. and 16 others (2005) Multispectral Imaging contributions to Global Land Ice Measurements from Space, Special Issue on Terra/ ASTER Science. Remote Sensing of Environment 99, 187-219
Mapping alluvial gully erosion in Australia tropical rivers Knight, J., Spencer, J. Brooks, A. & Phinn, S. “Large-Area, High-Resolution Remote Sensing Based Mapping of Alluvial Gully Erosion in Australia’s Tropical Rivers”. Proceedings of the 5th Australian Stream Management Conference Proceedings, Albury, NSW May 2007
Aqua http://aqua.nasa.gov/