The F-Distribution
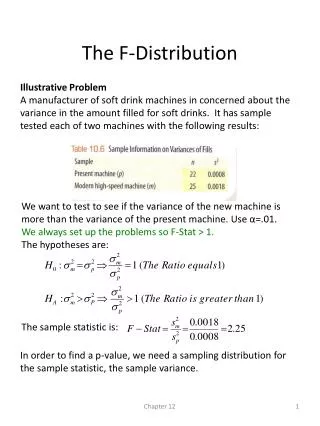
The F-Distribution. Illustrative Problem A manufacturer of soft drink machines is concerned about the variance in the amount filled for soft drinks. It has sample tested each of two machines with the following results:.

The F-Distribution
E N D
Presentation Transcript
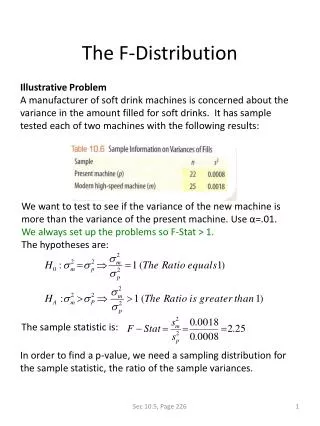
The F-Distribution Illustrative Problem A manufacturer of soft drink machines is concerned about the variance in the amount filled for soft drinks. It has sample tested each of two machines with the following results: We want to test to see if the variance of the new machine is more than the variance of the present machine. Use α=.01. We always set up the problems so F-Stat > 1.The hypotheses are: The sample statistic is: In order to find a p-value, we need a sampling distribution for the sample statistic, the ratio of the sample variances. Sec 10.5, Page 226
The F-Distribution 4. Each sample must be from a normal distribution Sec 10.5, Page 226
Finding the P-Value We now have the F-Distribution, with an F-Stat of 2.25, df for the numerator of 24, and df for the denominator of 21. We will use the Add-In Program FDIST. F Distribution (24, 21) P-Value = 0.0323 F = 2.25 PRGM – FDIST LOWER BOUND: 2.25 UPPER BOUND: 2ND E99 df NUMERATOR: 24 df DENOMINATOR: 21 OUTPUT: P-VALUE = 0.0323 Sec 10.5, Page 226
Illustrative Problem (24, 21) P-value = 0.0323 F=2.25 Solving using TI-83 Black Box Program STAT-TESTS-E:2SampFTest Input: Stats Sx1: (Problem gives s2, TI-83 requires Sx) n1: 25 Sx2: n2: 22 σ1 > σ2 P-Value = 0.0323; F = 2.25Ho cannot be rejected at α=0.01. Sec 10.5, Page 226
Problem Problems, Page 234
Problems Problems, Page 234
Problem Set up the problem so that the the F-Stat >1. • State the necessary hypotheses. • Find the p-value and state your conclusion. • What is the name of the model used for the sampling distribution? Problems, Page 234
Analysis of Variance The analysis of variance process (ANOVA) will be used to test hypotheses about several means. We have previously looked at the Goodness of Fit process that tests several proportions. We have looked at hypotheses tests for one mean, two means, and now we examine several means. The (ANOVA) process requires the F- Distribution for the sampling distribution. Conditions required for (ANOVA) is that: 1. Samples are random and independent of each other. 2. The effect of untested factors is normally distributed and has constant variance. The typical hypotheses is: Sec 12.1, Page 254
Illustrative Problem The temperature at which a manufacturing process is believed to affect the productivity of the process. Three different production samples were taken when the temperature variable (factor) is at three different temperatures. Following is the data: The three means appear to be different based on the samples. We want to test to see if that is a real difference or a difference solely due to sampling variation. We will assume the necessary conditions for ANOVA are met. The hypotheses are: Sec 1.1, Page 256
ILLUSTRATIVE PROBLEMBOX PLOT DISPALY To get a picture of these three distributions, we make side-by-side box plots. On the TI-84, we input the data into Lists 1, 2, and 3. We then go to 2nd Statplot and and set up a box plot for list 1 in Plot1, for list 2 in Plot2 and for list 3 in Plot 3. We select ZoomStat. Plot 1 68° Plot 2 72° Plot 3 76° Sec 12.1, Page 256
Illustrative Problem: F Stat In order to find a p-value from the F-Distribution, we need to develop an F Statistic. We will do this by developing a ratio of two sum of squares calculations. Recall that the formula for the variance is: . We use the numerator to develop the sum of the squares. SS(Total) is the sum of the squares if the three sets of data were use to develop one grand mean. SS(Total) = 94. Since there are thirteen numbers, the degrees of freedom for this calculation is 13-1=12. SS(Factor), SS(Temperature) is this problem,is the sum of the squares for each of the three samples, added together. SS(Treatment) = 84.5. Since there are three samples, the degrees of freedom for this calculation is 3-1 = 2. SS(Error) is SS(Total) – SS(Factor) = 94 – 84.5 = 9.5. The degrees of freedom for this calculation is 12 – 2 = 10. Mean Square for Factor: (Variation between sample means) Mean Square for Error: (Variation within samples) Sec 12.1, Page 258
Illustrative Problem: F Stat The resulting ANOVA table for this problem is as follows: = 0.00001 Since the p-value is less than α=.05, we reject Ho and conclude that at least one of the means is different. Follow up analysis would be needed to determine which one. Sec 12.1, Page 258
Illustrative Problem- TI-83Data in Lists STAT – Edit (Enter Data in L1, L2, L3) PRGM – ANOVA2 NUM LISTS? 3 (Enter the three lists) Output: P-VALUE = 1.0543E-5; F = 44.4737; MSF = 42.25; MSE=.95 Sec 12.1, Page 258
Illustrative Problem- TI-83Statistics Input An experiment was done with three measured treatments. The statistics are given below: 2nd Matrix (Enter the data in matrix A as shown) PRGM-ANOVA2 2: STATS IN MATX ENTER 1 (CONTINUE) ENTER OUTPUT: P-Value = 2.2793 E-4: F=14.1109 Chapter 12
Problems Sec 12.1, Page 267
Problems Problems, Page 270
Problems • State the necessary hypotheses. • Sketch the side-by-side box plots. Does it appear that the means are all the same? • Find the p-value and state your conclusion. • What is the name of the model used for the sampling distribution? Sec 12.1, Page 268
Problems • Test the hypotheses that not all the mean commute times are all the same. State the appropriate hypothesis. • Find the p-value and state your conclusion. • What is the name of the sampling distribution? • What is the F-Statistic, the df numerator and df denominator? Problems, Page 268