
Bayesian Networks: Concepts & Applications for Probabilistic Reasoning
E N D
Presentation Transcript
Bayesian Networks Read R&N Ch. 14.1-14.2 Next lecture: Read R&N 18.1-18.4
You will be expected to know • Basic concepts and vocabulary of Bayesian networks. • Nodes represent random variables. • Directed arcs represent (informally) direct influences. • Conditional probability tables, P( Xi | Parents(Xi) ). • Given a Bayesian network: • Write down the full joint distribution it represents. • Given a full joint distribution in factored form: • Draw the Bayesian network that represents it. • Given a variable ordering and some background assertions of conditional independence among the variables: • Write down the factored form of the full joint distribution, as simplified by the conditional independence assertions.
Why Bayesian Networks? • Knowledge Representation & Reasoning (Inference) • Propositional Logic • Knowledge Base : Propositional logic sentences • Reasoning : KB |= Theory • Find a model or Count models • Probabilistic Reasoning • Knowledge Base : Full joint probability over all random variables • Reasoning: Compute Pr ( KB |= Theory ) • Find the most probable assignments • Compute marginal / conditional probability • Why Bayesian Net? • Manipulating full joint probability distribution is very hard! • Exploit conditional independence properties of our distribution • Bayesian Network captures conditional independence • Graphical Representation (Probabilistic Graphical Models) • Tool for Reasoning, Computation (Probabilistic Reasoning bases on the Graph)
Conditional independence • Recall: chain rule of probability • p(x,y,z) = p(x) p(y|x) p(z|x,y) • Some of these models will be conditionally independent • e.g., p(x,y,z) = p(x) p(y|x) p(z|x) • Some models may have even more independence • E.g., p(x,y,z) = p(x) p(y) p(z) • The more independence and conditional independence, the more compactly we can represent and reason over the joint probability distribution. p(x) p(y|x) p(z|x,y) p(x) p(y|x) p(z|x) p(x) p(y) p(z)
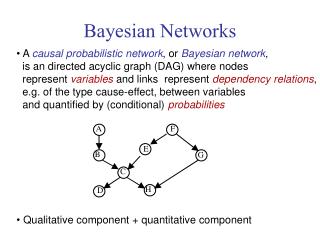
B A C Bayesian Network • A Bayesian network specifies a joint distribution in a structured form: (A and B are independent of all variables; C depends on A and B) • Dependence/independence represented via a directed graph: • Node = random variable • Directed Edge = conditional dependence • Absence of Edge = conditional independence • Allows concise view of joint distribution relationships: • Graph nodes and edges show conditional relationships between variables. • Tables provide probability data. • Tables are concise!! P( A) is not shown since it can be inferred as (1 − P(A) ), etc. p(A,B,C) = p(C|A,B)p(A)p(B)
Bayesian Networks • Structure of the graph Conditional independence relations • Requires that graph is acyclic (no directed cycles) • 2 components to a Bayesian network • The graph structure (conditional independence assumptions) • The numerical probabilities (for each variable given its parents) • Also known as belief networks, graphical models, causal networks • Parents in the graph conditioning variables (RHS) in the formula In general, p(X1, X2,....XN) = p(Xi | parents(Xi ) ) The graph-structured approximation The full joint distribution
A C B Extended example of 3-way Bayesian Networks Conditionally independent effects: p(A,B,C) = p(B|A)p(C|A)p(A) B and C are conditionally independent Given A E.g., A is a disease, and we model B and C as conditionally independent symptoms given A E.g., A is Fire, B is Heat, C is Smoke. “Where there’s Smoke, there’s Fire.” If we see Smoke, we can infer Fire. If we see Smoke, observing Heat tells us very little additional information. Parents in the graph conditioning variables (RHS)
A= Fire C= Heat B= Smoke Extended example of 3-way Bayesian NetworksSuppose I build a fire in my fireplace about once every 10 days… Conditionally independent effects: P(A,B,C) = P(B|A)P(C|A)P(A) Smoke and Heat are conditionally independent given Fire. If we see B=Smoke, observing C=Heat tells us very little additional information.
A= Fire C= Heat B= Smoke Extended example of 3-way Bayesian Networks What is P(Fire=t | Smoke=t)? P(Fire=t | Smoke=t) =P(Fire=t & Smoke=t) / P(Smoke=t)
A= Fire C= Heat B= Smoke Extended example of 3-way Bayesian Networks What is P(Fire=t & Smoke=t)? P(Fire=t & Smoke=t) =_heat P(Fire=t&Smoke=t&heat) =_heat P(Smoke=t&heat|Fire=t)P(Fire=t) =_heat P(Smoke=t|Fire=t) P(heat|Fire=t)P(Fire=t)=P(Smoke=t|Fire=t) P(heat=t|Fire=t)P(Fire=t) +P(Smoke=t|Fire=t)P(heat=f|Fire=t)P(Fire=t) = (.90x.99x.1)+(.90x.01x.1) = 0.09
A= Fire C= Heat B= Smoke Extended example of 3-way Bayesian Networks What is P(Smoke=t)? P(Smoke=t) =_fire _heat P(Smoke=t&fire&heat) =_fire _heat P(Smoke=t&heat|fire)P(fire) =_fire _heat P(Smoke=t|fire) P(heat|fire)P(fire)=P(Smoke=t|fire=t) P(heat=t|fire=t)P(fire=t) +P(Smoke=t|fire=t)P(heat=f|fire=t)P(fire=t) +P(Smoke=t|fire=f) P(heat=t|fire=f)P(fire=f) +P(Smoke=t|fire=f)P(heat=f|fire=f)P(fire=f) = (.90x.99x.1)+(.90x.01x.1) +(.001x.0001x.9)+(.001x.9999x.9) 0.0909
A= Fire C= Heat B= Smoke Extended example of 3-way Bayesian Networks What is P(Fire=t | Smoke=t)? P(Fire=t | Smoke=t) =P(Fire=t & Smoke=t) / P(Smoke=t) 0.09 / 0.0909 0.99 So we’ve just proven that “Where there’s smoke, there’s (probably) fire.”
A B C Examples of 3-way Bayesian Networks Marginal Independence: p(A,B,C) = p(A) p(B) p(C) Parents in the graph conditioning variables (RHS)
A B C Examples of 3-way Bayesian Networks Independent Causes: p(A,B,C) = p(C|A,B)p(A)p(B) “Explaining away” effect: Given C, observing A makes B less likely e.g., earthquake/burglary/alarm example A and B are (marginally) independent but become dependent once C is known Parents in the graph conditioning variables (RHS)
A B C Examples of 3-way Bayesian Networks Markov dependence: p(A,B,C) = p(C|B) p(B|A)p(A) Parents in the graph conditioning variables (RHS)
Burglar Alarm Example • Consider the following 5 binary variables: • B = a burglary occurs at your house • E = an earthquake occurs at your house • A = the alarm goes off • J = John calls to report the alarm • M = Mary calls to report the alarm • What is P(B | M, J) ? (for example) • We can use the full joint distribution to answer this question • Requires 25 = 32 probabilities • Can we use prior domain knowledge to come up with a Bayesian network that requires fewer probabilities?
The Causal Bayesian Network Generally, order variables so that resulting graph reflects assumed causal relationships. Only requires 10 probabilities!
Constructing a Bayesian Network: Step 1 • Order the variables in terms of influence (may be a partial order) e.g., {E, B} -> {A} -> {J, M} • Now, apply the chain rule, and simplify based on assumptions • P(J, M, A, E, B) = P(J, M | A, E, B) P(A| E, B) P(E, B) ≈ P(J, M | A) P(A| E, B) P(E) P(B) ≈ P(J | A) P(M | A) P(A| E, B) P(E) P(B) These conditional independence assumptions are reflected in the graph structure of the Bayesian network Generally, order variables so that resulting graph reflects assumed causal relationships.
P(J, M, A, E, B) = P(J | A) P(M | A) P(A | E, B) P(E) P(B) There are 3 conditional probability tables (CPDs) to be determined: P(J | A), P(M | A), P(A | E, B) Requiring 2 + 2 + 4 = 8 probabilities And 2 marginal probabilities P(E), P(B) -> 2 more probabilities Where do these probabilities come from? Expert knowledge From data (relative frequency estimates) Or a combination of both - see discussion in Section 20.1 and 20.2 (optional) Constructing this Bayesian Network: Step 2 Parents in the graph conditioning variables (RHS)
The Resulting Bayesian Network Parents in the graph conditioning variables (RHS) P(J, M, A, E, B) = P(J | A) P(M | A) P(A | E, B) P(E) P(B) Generally, order variables so that resulting graph reflects assumed causal relationships.
Example of Answering a Probability Query • So, what is P(B | M, J) ? E.g., say, P(b | m, j) , i.e., P(B=true | M=true J=false) P(b | m, j) = P(b, m, j) / P(m, j) ;by definition P(b, m, j) = A{a,a}E{e,e} P(j, m, A, E, b) ;marginal P(J, M, A, E, B) ≈ P(J | A) P(M | A) P(A| E, B) P(E) P(B) ; conditional indep. P(j, m, A, E, b) ≈ P(j | A) P(m | A) P(A| E, b) P(E) P(b) Say, work the case A=a E=e P(j, m, a, e, b) ≈ P(j | a) P(m | a) P(a| e, b) P(e) P(b) ≈ 0.10 x 0.70 x 0.94 x 0.998 x 0.001 Similar for the cases of ae, ae, ae. Similar for P(m, j). Then just divide to get P(b | m, j).
Inference in Bayesian Networks • X= { X1, X2, …, Xk } = query variables of interest • E = { E1, …, El } = evidence variables that are observed • (e, an event) • Y = { Y1, …, Ym } = hidden variables (nonevidence, nonquery) • What is the posterior distribution of X, given E? • P( X|e ) = αΣyP( X, y, e ) • What is the most likely assignment of values to X, given E? • argmaxx P( x | e ) = argmaxxΣy P( x, y, e )
A B C D Inference in Bayesian NetworksSimple Example P(A) .05 Disease1 P(B) .02 Disease2 } Query Variables A, B A B P(C|A,B) t t .95 t f .90 f t .90 f f .005 TempReg } Hidden Variable C C P(D|C) t .95 f .002 Fever } Evidence Variable D Note: Not an anatomically correct model of how diseases cause fever! Suppose that two different diseases influence some imaginary internal body temperature regulator, which in turn influences whether fever is present.
A B C D Inference in Bayesian NetworksSimple Example P(A) .05 Disease1 P(B) .02 Disease2 What is the posterior conditional distribution of our query variables, given that fever was observed? P(A,B|d) = αΣc P(A,B,c,d) =αΣcP(A)P(B)P(c|A,B)P(d|c) = αP(A)P(B)ΣcP(c|A,B)P(d|c) A B P(C|A,B) t t .95 t f .90 f t .90 f f .005 TempReg C P(D|C) t .95 f .002 Fever P(a,b|d) = αP(a)P(b)ΣcP(c|a,b)P(d|c) = αP(a)P(b){ P(c|a,b)P(d|c)+P(c|a,b)P(d|c) } = α .05x.02x{.95x.95+.05x.002} α .000903 .014 P(a,b|d) = α P(a)P(b) Σc P(c|a,b)P(d|c) = α P(a)P(b){ P(c|a,b)P(d|c)+P(c|a,b)P(d|c) } = α.95x.02x{.90x.95+.10x.002} α .0162 .248 P(a,b|d) = α P(a)P(b) Σc P(c|a,b)P(d|c) = α P(a)P(b){ P(c|a,b)P(d|c)+P(c|a,b)P(d|c) } = α .05x.98x{.90x.95+.10x.002} α .0419 .642 P(a,b|d) = α P(a)P(b) Σc P(c|a,b)P(d|c) = α P(a)P(b){ P(c|a,b)P(d|c)+P(c|a,b)P(d|c) } = α .95x.98x{.005x.95+.995x.002} α.00627 .096 α 1 / (.000903+.0162+.0419+.00627) 1 / .06527 15.32
A B C D Inference in Bayesian NetworksSimple Example P(A) .05 Disease1 P(B) .02 Disease2 What is the most likely posterior conditionalassignment of values to our query variables, given that fever was observed? argmax{a,b}P( a, b | d ) = argmax{a,b} Σ cP( a,b,c,d ) = { a,b } A B P(C|A,B) t t .95 t f .90 f t .90 f f .005 TempReg C P(D|C) t .95 f .002 Fever P(a,b|d) = αP(a)P(b)ΣcP(c|a,b)P(d|c) = αP(a)P(b){ P(c|a,b)P(d|c)+P(c|a,b)P(d|c) } = α .05x.02x{.95x.95+.05x.002} α .000903 .014 P(a,b|d) = α P(a)P(b) Σc P(c|a,b)P(d|c) = α P(a)P(b){ P(c|a,b)P(d|c)+P(c|a,b)P(d|c) } = α.95x.02x{.90x.95+.10x.002} α .0162 .248 P(a,b|d) = α P(a)P(b) Σc P(c|a,b)P(d|c) = α P(a)P(b){ P(c|a,b)P(d|c)+P(c|a,b)P(d|c) } = α .05x.98x{.90x.95+.10x.002} α .0419 .642 P(a,b|d) = α P(a)P(b) Σc P(c|a,b)P(d|c) = α P(a)P(b){ P(c|a,b)P(d|c)+P(c|a,b)P(d|c) } = α .95x.98x{.005x.95+.995x.002} α.00627 .096 α 1 / (.000903+.0162+.0419+.00627) 1 / .06527 15.32
A B C D Inference in Bayesian NetworksSimple Example P(A) .05 Disease1 P(B) .02 Disease2 What is the posterior conditional distribution of A, given that fever was observed? (I.e., temporarily make B into a hidden variable.) We can use P(A,B|d) from above. P(A|d) = αΣb P(A,b|d) A B P(C|A,B) t t .95 t f .90 f t .90 f f .005 TempReg C P(D|C) t .95 f .002 Fever P(a|d) = Σb P(a,b|d) = P(a,b|d)+P(a,b|d) = (.014+.642) .656 P(a|d) = Σb P(a,b|d) = P(a,b|d)+P(a,b|d) = (.248+.096) .344 This is a marginalization, so we expect from theory that α= 1; but check for round-off error. A B P(A,B|d) from above t t .014 f t .248 t f .642 f f .096
A B C D Inference in Bayesian NetworksSimple Example P(A) .05 Disease1 P(B) .02 Disease2 What is the posterior conditional distribution of A, given that fever was observed, and that further lab tests definitely rule out Disease2? (I.e., temporarily make B into an evidence variable with B = false.) P(A|b,d) = αP(A,b|d) A B P(C|A,B) t t .95 t f .90 f t .90 f f .005 TempReg C P(D|C) t .95 f .002 Fever P(a|b,d) = α P(a,b|d) α .642 .870 P(a|b,d) = αP(a,b|d) α.096 .130 α 1 / (.642+.096) 1 / .738 1.355 A B P(A,B|d) from above t t .014 f t .248 t f .642 f f .096
General Strategy for inference • Want to compute P(q | e) Step 1: P(q | e) = P(q,e)/P(e) = a P(q,e), since P(e) is constant wrt Q Step 2: P(q,e) = Sa..z P(q, e, a, b, …. z), by the law of total probability Step 3: • Sa..z P(q, e, a, b, …. z) = Sa..zPi P(variable i | parents i) • (using Bayesian network factoring) Step 4: Distribute summations across product terms for efficient computation Section 14.4 discusses exact inference in Bayesian Networks. The complexity depends strongly on the network structure. The general case is intractable, but there are things you can do. Section 14.5 discusses approximation by sampling.
Number of Probabilities in Bayesian Networks • Consider n binary variables • Unconstrained joint distribution requires O(2n) probabilities • If we have a Bayesian network, with a maximum of k parents for any node, then we need O(n 2k) probabilities • Example • Full unconstrained joint distribution • n = 30, k = 4: need 109 probabilities for full joint distribution • Bayesian network • n = 30, k = 4: need 480 probabilities
The Causal Bayesian Network P(J, M, A, E, B) = P(J | A) P(M | A) P(A | E, B) P(E) P(B) Generally, order variables so that resulting graph reflects assumed causal relationships.
The Bayesian Network From a Different Variable Ordering Parents in the graph conditioning variables (RHS) P(J, M, A, E, B) = P(E | A, B) P(B | A) P(A | M, J) P(J | M) P(M) Generally, order variables so that resulting graph reflects assumed causal relationships.
The Bayesian Network From a Different Variable Ordering Parents in the graph conditioning variables (RHS) P(J, M, A, E, B) = P(A | B, E, M, J) P(B | E, M, J) P(E | M, J) P(J | M) P(M) Generally, order variables so that resulting graph reflects assumed causal relationships.
Given a graph, can we “read off” conditional independencies? The “Markov Blanket” of X (the gray area in the figure) X is conditionally independent of everything else, GIVEN the values of: * X’s parents * X’s children * X’s children’s parents X is conditionally independent of its non-descendants, GIVEN the values of its parents.
Naïve Bayes Model Xn X1 X3 X2 C P(C | X1,…,Xn) = a P P(Xi | C) P (C) Features X are conditionally independent given the class variable C Widely used in machine learning e.g., spam email classification: X’s = counts of words in emails Probabilities P(C) and P(Xi | C) can easily be estimated from labeled data
Naïve Bayes Model (2) P(C | X1,…Xn) = a P P(Xi | C) P (C) Probabilities P(C) and P(Xi | C) can easily be estimated from labeled data P(C = cj) ≈ #(Examples with class label cj) / #(Examples) P(Xi = xik | C = cj) ≈ #(Examples with Xi value xik and class label cj) / #(Examples with class label cj) Usually easiest to work with logs log [ P(C | X1,…Xn) ] = log a + [ log P(Xi | C) + log P (C) ] DANGER: Suppose ZERO examples with Xi value xik and class label cj ? An unseen example with Xi value xik will NEVER predict class label cj ! Practical solutions: Pseudocounts, e.g., add 1 to every #() , etc. Theoretical solutions: Bayesian inference, beta distribution, etc.
Hidden Markov Model (HMM) Observed Y3 Yn Y1 Y2 - - - - - - - - - - - - - - - - - - - - - - - - - - - - - - - - - - - - - - - - - - - - - - - - - - - - Hidden S3 Sn S1 S2 Two key assumptions: 1. hidden state sequence is Markov 2. observation Yt is CI of all other variables given St Widely used in speech recognition, protein sequence models Since this is a Bayesian network polytree, inference is linear in n
Examples of “real world” Bayesian Networks --- Alarm network The “alarm” network: 37 variables, 509 parameters (rather than 237 = 1011!) [Beinlich et al., 1989] MINVOLSET KINKEDTUBE PULMEMBOLUS INTUBATION VENTMACH DISCONNECT PAP SHUNT VENTLUNG VENITUBE PRESS MINOVL FIO2 VENTALV PVSAT ANAPHYLAXIS ARTCO2 EXPCO2 SAO2 TPR INSUFFANESTH HYPOVOLEMIA LVFAILURE CATECHOL LVEDVOLUME STROEVOLUME ERRCAUTER HR ERRBLOWOUTPUT HISTORY CO CVP PCWP HREKG HRSAT HRBP BP
Examples of “real world” Bayesian Networks --- SMALL MINVOLSET KINKEDTUBE PULMEMBOLUS INTUBATION VENTMACH DISCONNECT PAP SHUNT VENTLUNG VENITUBE PRESS MINOVL FIO2 VENTALV PVSAT ANAPHYLAXIS ARTCO2 EXPCO2 SAO2 TPR INSUFFANESTH HYPOVOLEMIA LVFAILURE CATECHOL LVEDVOLUME STROEVOLUME ERRCAUTER HR ERRBLOWOUTPUT HISTORY CO CVP PCWP HREKG HRSAT HRBP BP
Examples of “real world” Bayesian NetworksGenetic linkage analysis ? | ? ? | ? A | a B | b 1 2 A | A B | b ? | A ? | B 3 4 - 6 individuals - Haplotype: {2, 3} - Genotype: {6} - Unknown ? | ? ? | ? A | a B | b 5 6
Examples of “real world” Bayesian NetworksPedigree model: 6 people, 3 markers L12m L12f L11m L11f X12 X11 S15m S13m L13m L13f L14m L14f X14 X13 S15m S15m L15m L15f L16m L16f S16m S15m X15 X16 L22m L22f L21m L21f X22 X21 S25m S23m L23m L23f L24m L24f X23 X24 S25m S25m L25m L25f L26m L26f S26m S25m X25 X26 L32m L32f L31m L31f X32 X31 S35m S33m L33m L33f L34m L34f X33 X34 S35m S35m L35m L35f L36m L36f S36m S35m X35 X36
Summary • Bayesian networks represent a joint distribution using a graph • The graph encodes a set of conditional independence assumptions • Answering queries (or inference or reasoning) in a Bayesian network amounts to efficient computation of appropriate conditional probabilities • Probabilistic inference is intractable in the general case • But can be carried out in linear time for certain classes of Bayesian networks