
Fluorescence Imaging of Cellular Structures in Smooth Muscle Cells on Various Substrates
This study presents fluorescence images illustrating the distribution of actin-continuous fibers (ACFs) and nesprin-1 in smooth muscle cells (SMCs) across different substrates, including glass and polyacrylamide gel. Supplementary Figures showcase examples of cellular structures, highlighting significant differences in the frequency of ACFs and DNA alignments on these substrates. The effect of the actin-sequestering drug latrunculin B on the structural stability of ACFs and BSFs is also examined, providing insights into the dynamic behavior of these cytoskeletal components. Scale bars indicate distances for accurate analysis.

Fluorescence Imaging of Cellular Structures in Smooth Muscle Cells on Various Substrates
E N D
Presentation Transcript
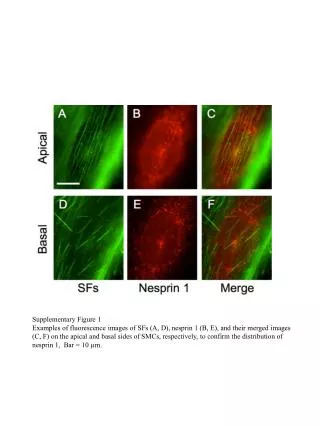
Supplementary Figure 1 Examples of fluorescence images of SFs (A, D), nesprin 1 (B, E), and their merged images (C, F) on the apical and basal sides of SMCs, respectively, to confirm the distribution of nesprin 1, Bar = 10 µm.
J K P < 0.05 P < 0.05 Frequency of cells showing ACFs (%) Frequency of cells showing DNA-Line (%) Glass PA-gel (6 kPa) Glass PA-gel (6 kPa) Supplementary Figure 2 Typical examples of fluorescent images of ACFs and nucleus in SMCs on glass (A–E) and the soft polyacrylamide gel (F–I) substrates. Nore that the higher magnification of nuclaus in dashed rectangle area in D shows a linear concentration of perinuclear DNA aligned the ACF (E, arrowheads). The frequency of cells showingACF (J), and the frequency of cells showing linear DNA concentrations (K) were also obtained and compared between the cells cultured on glass and the gel substrate. Bars = 20 µm.
Supplementary Figure 3 Examples of fluorescent images of ACFs above the nucleus (A, D), nucleus (B, E), and BSFs underneath the nucleus (C, F). Scale bars = 10 µm. Dashed lines represent the direction of the nuclear major axis.
Supplementary Figure 4 A typical example of fluorescent images of ACFs (A), BSFs (B), and nucleus (C) following treatment with the actin-sequestering drug latrunculin B (60 nM for 60 min). Dashed lines in A and B represent the outline of the nuclei. Note that ACFs showed much faster disassembly than BSFs during treatment with latrunculin B. Bar = 20 µm.


