Weighted Flow graphs for statistics
This paper discusses methods of visualizing flow data, specifically in the context of official statistics, such as demography, migration, and international trade. It emphasizes the importance of weighted directed graphs in representing these flows accurately. The document presents various visualization techniques, including Sankey diagrams and flow maps, and highlights the challenges of visual clutter. An experiment involving internal migration data in the Netherlands is conducted to illustrate these methods, demonstrating how improved visual encoding and user interaction can enhance the understanding of flow patterns.

Weighted Flow graphs for statistics
E N D
Presentation Transcript
Weighted Flow graphs for statistics Edwin de Jonge NTTS February 2009
Statistics and flows • Many official statistics are flow data • Demography • Migration • International trade But also balance systems: • System of National Accounts (SNA) • Energy balance
Statistics and visualisation • Visualisation exploits visual system to: • Reveal and highlight patterns in data(trends, correlation, distribution) • Most common visualisations • line and bar charts • scatter and bubble plots • Cartographic choropleth
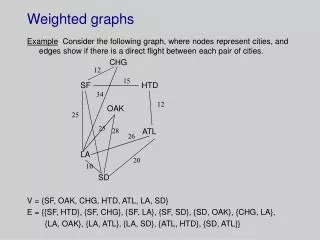
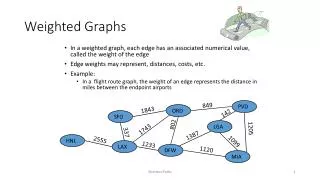
Flow visualization • Many official statistics are flow data • But not presented as flows! • Flow diagram is weighted directed graph • G = (V,E,w) • Not many visualisation research for weighted directed graphs
Flow visualisation (2) Options • Standard node and edge visualisation • Not real option: does not encode the weights (= data) • Sankey diagrams • Very good for energy statistics etc.! • Cartographic flows • Arrows on a cartographic map
Cartographic flows • Flow maps: • Many are hand made • Flow routing is hard • Number of flows is limited to 50 • Most are unidirectional Computer generated cartographic flow layout is still scarce
Experiment: large flow map • Most statistical datasets are large! • Experiment to visualise • Thousands of flows, that are bidirectional, every flow may have a counter flow • It should: • give overview of all flows • show main flows • reveal flow patterns
Experiment: Internal migration • Migration between 459 municipalities in the Netherlands • Migration is matrix M(i,j) i, j = 1..N • mij= migration from i to j • Large number of flows and bidirectional
Experiment: Internal migration • Data summary: • 60,000 movements (of the 210,000) • Mean = 10, Max = 2880, Median = 2 = Skewed! • Technology: • Google Earth, KML file • Generate arrows as polygons in KML
Naïve implementation • Too many arrows • Visual clutter: • no overview • no main flows • no flow patterns
Visual encoding • Use visual encoding to reduce clutter • Arrow • Width: logarithmic scale • Encodes size of flows • Transparency: logarithmic scale • Reduces visual clutter • Height: linear scale • Focus on main flows
User interaction / Results • Use user interaction to filter data • user can select regions (no flows) Results • Clear overview of overall flows • Main flows are visible • Non local flows are also visible • But no other patterns!
Discussion • Result is ok, but should be further improved • Better user interaction • GE user interaction very limited • Select and filter for flows • Reveal patterns in flow data • Use cluster techniques to group flows • User cluster techniques to group regions