c 2 test for independence
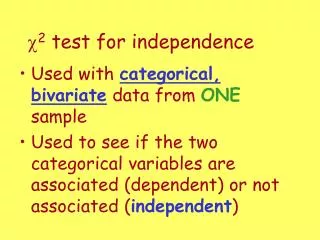
c 2 test for independence. Used with categorical, bivariate data from ONE sample Used to see if the two categorical variables are associated (dependent) or not associated ( independent ). Assumptions & formula remain the same!. Hypotheses – written in words.


c 2 test for independence
E N D
Presentation Transcript
c2 test for independence • Used with categorical, bivariate data from ONEsample • Used to see if the two categorical variables are associated (dependent) or not associated (independent)
Hypotheses – written in words H0: two variables are independent Ha: two variables are dependent Be sure to write in context!
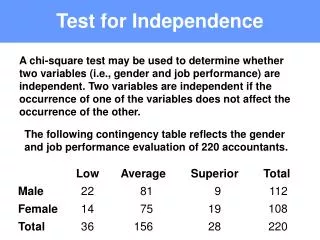
A beef distributor wishes to determine whether there is a relationship between geographic region and cut of meat preferred. If there is no relationship, we will say that beef preference is independent of geographic region. Suppose that, in a random sample of 500 customers, 300 are from the North and 200 from the South. Also, 150 prefer cut A, 275 prefer cut B, and 75 prefer cut C.
If beef preference is independent of geographic region, how would we expect this table to be filled in? 90 60 165 110 45 30
Assuming H0 is true, Expected Counts
Degrees of freedom Or cover up one row & one column & count the number of cells remaining!
Now suppose that in the actual sample of 500 consumers the observed numbers were as follows: (on your paper) Is there sufficient evidence to suggest that geographic regions and beef preference are not independent? (Is there a difference between the expected and observed counts?)
Assumptions: • Have a random sample of people • All expected counts are greater than 5. • H0: geographic region and beef preference are independentHa: geographic region and beef preference are dependent • P-value = .0226 df = 2 a = .05 • Since p-value < a, I reject H0. There is sufficient evidence to suggest that geographic region and beef preference are dependent. Expected Counts: N S A 90 60 B 165 110 C 45 30
c2 test for homogeneity • Used with a single categorical variable from two (or more) independent samples • Used to see if the two populations are the same (homogeneous)
Assumptions & formula remain the same! Expected counts & df are found the same way as test for independence. Only change is the hypotheses!
Hypotheses – written in words H0: the two (or more) distributions are the same Ha: the distributions are different Be sure to write in context!
College Students’ Drinking Levels The data on drinking behavior for independently chosen random samples of male and female students was collected. Does there appear to be a gender difference with respect to drinking behavior?
Expected Counts: M F 0 158.6 167.4 L 554.0 585.0 M 230.1 243.0 H 38.4 40.6 • Assumptions: • Have 2 random sample of students • All expected counts are greater than 5. • H0: drinking behavior is the same for female & male studentsHa: drinking behavior is not the same for female & male students • P-value = .000 df = 3 a = .05 • Since p-value < a, I reject H0. There is sufficient evidence to suggest that drinking behavior is not the same for female & male students.
Titanic Moviemakers of Titanic imply that lower-class passengers were treated unfairly. Was that accurate?
Likelihood of Survival on Titanic? Ho: C = 109/1318, W = 402/1318, M = 807/1318 Ha: at least one is different 2 = 225.16, df = 2, P(2 > 225.16) = 0.000 Reject Ho and conclude at least one proportion is different.