Download
1 / 16
160 likes | 263 Vues
Section 19-1 & 19-2 Populations. Population Properties. A population is defined as a group of organisms belonging to the same species that live in the same place at the same time .

E N D
Population Properties A population is defined as a group of organisms belonging to the same speciesthat live in the same place at the same time. A population of deer in western Pennsylvania would be distinct from one in northern Ohio because they would rarely interact to mate. Modern humans are not in the same population with neanderthalstoday even though they could mate to produce offspring in the past.
Population Properties There are three properties that can be used to describe populations. The first is population sizeand simply refers to the number of organisms. The second is population density which is the number of organisms found per area (land) or volume (water). Density provides more information regarding biotic or abiotic factors that can limit or support growth of a population.
Population Properties The third property is dispersion which accounts for how the organisms are distributed within the population. They can be clumped for defense or resource use in harsh climates. They can be uniform to reduce competition but within mating distance. They can be random is dispersal is dependent on wind for seeds or pockets of resources for animals.
Population Dynamics Changes in populations can be measured by comparing natality(birth rate) to mortality (death rate) within the population. The average life span or life expectancy affects population growth. It is most impacted by infant mortality followed by risk factors. Age structure diagrams can provide information on life span based on gender and % of the population with regard to reproductive capacity.
Population Dynamics Survivorship curves can be used to show the probability that members of a population will live to a certain age. Type I curves show low infant mortality and high survivorship. Type II curves show even levels of infant mortality and survivorship. Type IIIcurves show high infant mortality and low survivorship.
Population Growth Rate The growth rate is a change in the population’s size and can be either positive or negative. The growth rate is impacted by migrations, births and deaths. The following equation is used to calculate growth rate. Growth rate = (births + immigration) – (deaths + emmigrations)
The Exponential Model Exponential growth occurs when populations increase by a fixed percentage over time. This results in very slow growth initially followed by rapid increases. When graphed this produces a J-shaped curve and not a linear increase. Even a small increase in population growth can be magnified under this growth model.
The Exponential Model Exponential growth will occur if there are not many limiting factors and low rates of competition between or within populations. Species that have a high reproductive rate due to the fact that they can mature quickly, have many offspring at once and/or breed many times during the year are more likely to exhibit exponential growth. These r-selected species include bacteria, insects, rodents and annual plants.
The Logistic Model Logistic growthoccurs when populations increase by doubling followed by a leveling off period. This results in faster growth initially followed by a lag in growth. When graphed this produces an S-shaped curve. Growth is arithmetic and is not magnifiedunder this model.
The Logistic Model Logistic growth will occur if there are limiting factors and higher rates of competition between or within populations. Growth levels out when species reach the carrying capacity(K) which is the number of organisms the environment can support over time. K-selected species include most reptiles, birds, mammals and also perennial plants like trees and shrubs.
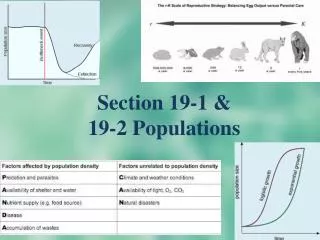
Population Regulation There are two kinds of limiting factors that regulate population growth. Density Independent factors reduce the population regardless of it’s density. Examples of these factors include things like human exploitation and weather such as droughts plus natural disasters such as floods and fires.
Population Regulation Density Dependent factors reduce population based on density. They includes biotic things like diseases, predators,and preyavailability. They also includes abiotic things like habitat space, water and light amount.
Population Regulation Some populations fluctuate based on the presence or absence of another population. Both populations increase and decrease in cycles due to coevolution. An example is the predator Canadian lynx and its prey the snowshoe hare. Because there are limited animals in an arctic food web, these two populations are more connected than many in more temperate climates.
The Perils of Small Populations As populations sizes decrease, the amount of genetic variability often decreases with it. A rapid reduction in population size can result in a genetic bottleneck occuring with reduces the number of alleles present in the population. If the environment changes the population may lack the alleles needed to survive and be at risk of extinction.
The Perils of Small Populations As populations sizes decrease the rate of mutation has more of an influence on the gene pool. Harmful recessive alleles are expressed more often which render members of the population unfit for survival. Populations with low genetic variation may also be subject to inbreeding which also leads to low genetic variation.