Stability and Activity of Porcine Lipase Under Temperature and Chemical Denaturants
This study investigates the stability and enzymatic activity of Porcine Lipase (PPL) in response to varying temperatures and the presence of chemical denaturants such as sodium dodecyl sulfate (SDS). Light scattering measurements and ellipticity changes were utilized to assess thermal denaturation and stability profiles. Results indicate varying stability and activity of PPL under different conditions, contributing to our understanding of this enzyme's performance in biotechnological applications.

Stability and Activity of Porcine Lipase Under Temperature and Chemical Denaturants
E N D
Presentation Transcript
SUPPLEMENTARY DATA Stability and Activity of Porcine Lipase against Temperature and Chemical Denaturants P. Krishna Chaitanya and N. Prakash Prabhu* Department of Biotechnology and Bioinformatics, School of Life sciences, University of Hyderabad, Hyderabad – 500 046, India
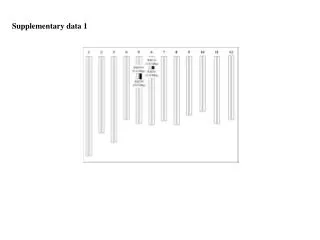
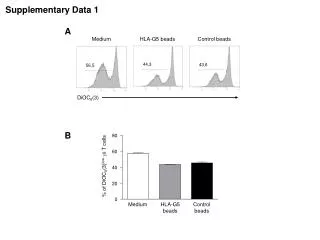
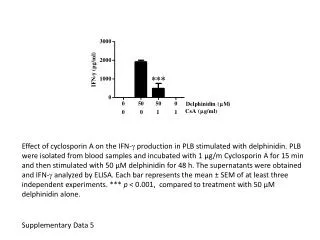
Figure S1 Light scattering intensity of PPL measured at 600 nm at varying temperatures increased from 20 °C to 60 °C (triangles) and decreased back to 20 °C (inverted triangles)
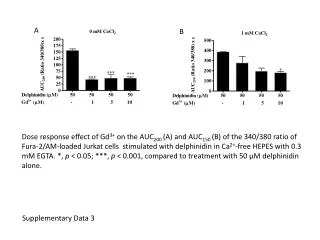
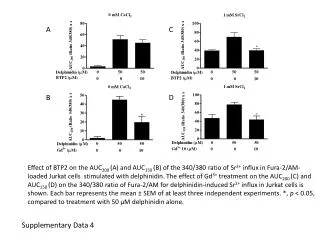
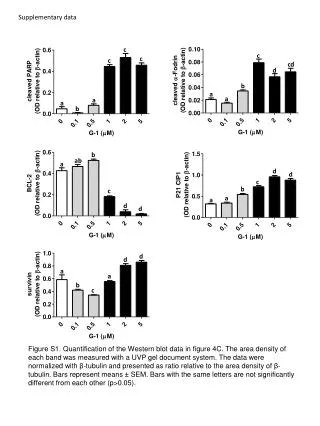
Figure S2 (A) Thermal denaturation of PPL followed from 20 °C to 80 °C in the absence (open circles) and the presence (open triangles) of 20 mM of SDS and the PPL pre-incubated at 80 °C for 15 min in the absence (filled circles) and the presence of (filled triangles) 20 mM of SDS monitored using ellipticity changes of PPL at 220 nm. (B) Ellipticity of PPL measured in far-UV region in the absence (solid lines) and in presence of 5 mM (dashed lines) or 20 mM (dashed and dotted lines) of SDS. The black lines represent the spectra measured before heating the samples, red lines represent the spectra of the samples heated to 80 °C and cooled back to room temperature, and the green lines represent the samples heated again to 80 °C and cooled back to room temperature. All the spectra were measured at 25 °C.
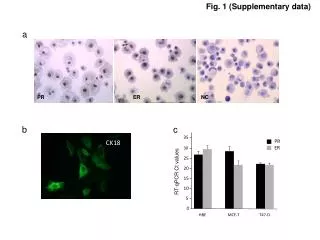
Figure S3 A B W253 lid C-terminal domain W86 C N-terminal domain (A and B) Electrostatic potential surface of PPL generated using PBEQ solver [1, 2]. The green ribbon represents the protein backbone and the active site is represented in magenta. (C) The cartoon diagram of the protein from Fig. 1 in the manuscript is reproduced for comparison. The protein orientations in all the images are same. 1. Im, W., Beglov, D., and B. Roux (1998) Continuum Solvation Model: Computation of Electrostatic Forces from Numerical Solutions to the Poisson-Boltzmann Equation. Comput. Phys. Comm.111,59-75 2. Jo, S., Vargyas, M., Vasko-Szedlar, J., Roux, B., and Im, W. (2008) PBEQ-Solver for Online Visualization of Electrostatic Potential of Biomolecules. Nucl. Acids Res.36, W270-275