Impact of Doxycycline-Induced NS1 Protein Levels on Influenza A Virus Infection
Study on NS1 protein levels in doxycycline-induced cells compared to IAV infection, with IFN-β expression analysis and fluorescence intensity courses.

Impact of Doxycycline-Induced NS1 Protein Levels on Influenza A Virus Infection
E N D
Presentation Transcript
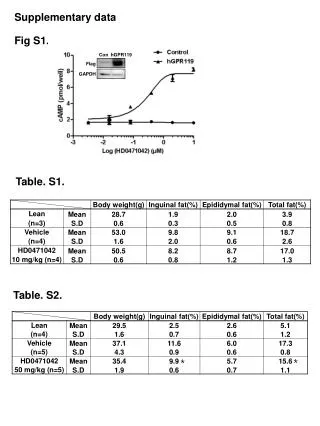
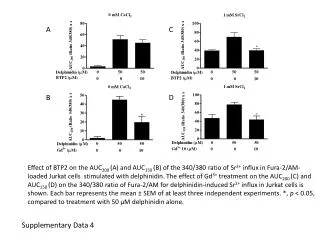
Supplementary Data Supplemental Figure S1. NS1 protein levels from doxycycline-induced tet.NS1-H cells compared to those of Influenza A virus infected cells. A: Increasing concentrations of doxycycline and different durations of treatment at saturating concentration were applied to tet.NS1-H expressing cells and NS1-levels were detected by Western blot. Levels were compared to those resulting from IAV PR8 infection at different time postinfection and two multiplicities of infection (MOI). B: Quantification of protein bands in A. A B
Supplemental Figure S2. Inducibility of IFN-β-tGFP expression in cells harboring tet.NS1-H or tet.NS3/4A-H construct in absence of doxycycline. Flow cytometric measurement of IFN-β-tGFP reporter cells either untransfected or stably expressing (A) tet.NS1-H or (B) tet.NS3/4A-H and the KRAB repressor 24h after infection with NDV. Infections in (A) and (B) were done with different virus stocks but same concentration (80 HAU/ml) resulting in different response frequencies. A uninfected + NDV IFN-β-tGFP cells IFN-β-tGFP tet.NS1 cells B uninfected + NDV IFN-β-tGFP cells IFN-β-tGFP tet.NS3/4A cells FSC IFN-β-tGFP
Supplemental Figure S3. Fluorescence intensity courses of doxycycline-induced tet.NS3/4A-H (black lines) and IFN-β-tGFP (grey lines) in single cells. Course of expression of IFN-β-tGFP and NS3/4A-H stained with TMR following NDV infection and Dox treatment. Each diagram represents one cell, grey lines show IFN-β-tGFP fluorescence intensity, black lines show NS3/4A-H bound TMR fluorescence intensity. Maximal IFN-β-tGFP signal (grey boxes) and start of NS3/4A-H signal increase (black boxes) as used for correlation analysis in Figure 3C are indicated.
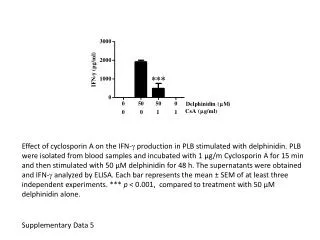
SupplementalFigure S4. Effectof NS1 expression on nuclearaccumulationperiodof IRF-7. NIH3T3 cellsstablyexpressingtheTet-inducible NS1 moduleand IRF-7-eCFP weretransfectedwithpoly I:C andstimulatedwithdoxycyclineorleftunstimulated. The periodof IRF-7-CFP nuclearaccumulationwithin individual cells was observed in fluorescence time-lapsemicroscopy. Error bars, SD (n = 50-55), t-test (ns = not significant).