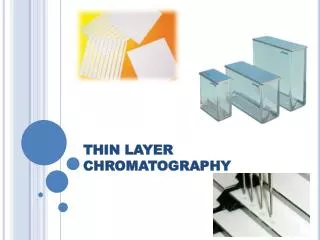
THIN LAYER CHROMATOGRAPHY (TLC)
350 likes | 3.15k Vues
THIN LAYER CHROMATOGRAPHY (TLC). Dr. P. S. Bhale Asst. Professor Department of Chemistry Y. C. Mahavidyalaya, Tuljapur. CHROMATOGRAPHY.

THIN LAYER CHROMATOGRAPHY (TLC)
E N D
Presentation Transcript
THIN LAYER CHROMATOGRAPHY(TLC) Dr. P. S. BhaleAsst. ProfessorDepartment of ChemistryY. C. Mahavidyalaya, Tuljapur
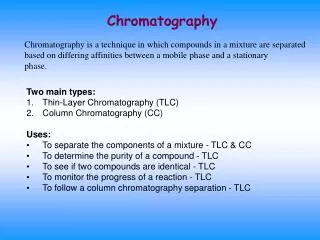
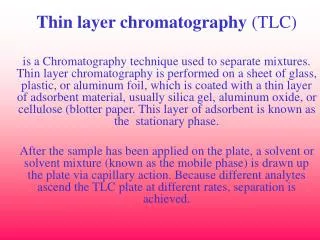
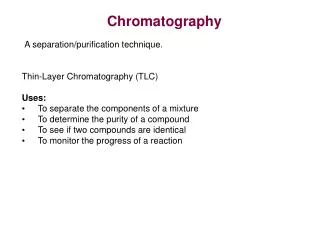
CHROMATOGRAPHY Chromatography is a physical process of separation in which the components to be separated are distributed between 2 immiscible phases a stationary phase which has a large surface area and mobile phase which is in constant motion through the stationary phase.
Mikhail Tsvet • Born 14 May 1872 • Asti, Italy • Died 26 June 1919 (age 47) • Nationality Russia • Fields botany • Mikhail Semyonovich Tsvet (Михаи́л Семёнович Цвет, also spelled Tsvett, Tswett, Tswet, Zwet, and Cvet) (1872–1919) was a Russian-Italian botanist who invented adsorption chromatography.
Invention of Chromatography by M. Tswett Ether Chromatography Colors Chlorophyll CaCO3
Comparing Chromatography to the Flow of a River... Light leaf Water flow Heavy stone Base
Chromato-graphy / -graph / -gram / -grapher • Chromatography: Analytical technique • Chromatograph: Instrument • Chromatogram: Obtained “picture” • Chromatographer: Person
Three States of Matter and Chromatography Types Gaschromatography Liquidchromatography
Liquid Chromatography • Chromatography in which the mobile phase is a liquid. • The liquid used as the mobile phase is called the “eluent”. • The stationary phase is usually a solid or a liquid. • In general, it is possible to analyze any substance that can be stably dissolved in the mobile phase.
Interaction Between Solutes, Stationary Phase, and Mobile Phase • Differences in the interactions between the solutes and stationary and mobile phases enable separation. Solute Degree of adsorption, solubility, ionicity, etc. Stationary phase Mobile phase
Classification • According to the force of separation: • Adsorption chromatography • Partition chromatography • Ion exchange chromatography • Gel filtration chromatography • Affinity chromatography
Column Chromatography and Planar Chromatography Separation column Paper or a substrate coated with particles Packing material Paper Chromatography Thin Layer Chromatography (TLC) Column Chromatography
Separation Process and Chromatogram for Column Chromatography Dr. A.R.Bekhradnia Chromatogram Output concentration Time
Chromatogram tR tR : Retention time Peak t0 Intensity of detector signal t0: Non-retention time h Dr. A.R.Bekhradnia A: Peak area A h: Peak height Time
Separation Process and Chromatogram for Column Chromatography Chromatogram Output concentration Time
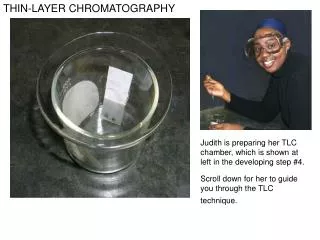
THIN LAYER CHROMATOGRAPHY • Once the solvent is within ~1-2 cm of the top of the TLC sheet, the TLC is removed from the developing chamber and the farthest extent of the solvent (the solvent front) is marked with a pencil. • The solvent is allowed to evaporate from the TLC sheet in the hood. • The spots are visualized using a UV lamp. • A fluorescent compound, usually Manganese-activated Zinc Silicate, is added to the adsorbent that allows the visualization of spots under a blacklight (UV254). The adsorbent layer will fluoresce light green by itself, but spots of analyte quench this fluorescence and appear as a dark spot. http://orgchem.colorado.edu/hndbksupport/TLC/TLCprocedure.html
THIN LAYER CHROMATOGRAPHY - Visualization • As the chemicals being separated may be colorless, several methods exist to visualize the spots: • Visualization of spots under a UV254 lamp. The adsorbent layer will thus fluoresce light green by itself, but spots of analyte quench this fluorescence. • Iodine vapors are a general unspecific color. • Specific color reagents exist into which the TLC plate is dipped or which are sprayed onto the plate. • Once visible, the Rf value of each spot can be determined Chromatogram of 10 essential oils, Stained with vanillin reagent.
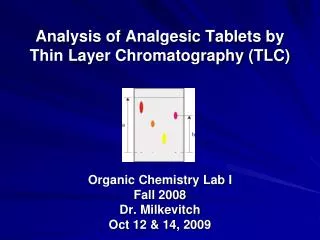
THIN LAYER CHROMATOGRAPHY Calculation of Rf’s The Rf is defined as the distance the center of the spot moved divided by the distance the solvent front moved (both measured from the origin)
THIN LAYER CHROMATOGRAPHY Calculation of Rf’s The Rf is defined as the distance the center of the spot moved divided by the distance the solvent front moved (both measured from the origin)
THIN LAYER CHROMATOGRAPHY – Rf’s Rf values can be used to aid in the identification of a substance by comparison to standards. The Rf value is not a physical constant, and comparison should be made only between spots on the same sheet, run at the same time. Two substances that have the same Rf value may be identical; those with different Rf values are not identical.
THIN LAYER CHROMATOGRAPHY – Rf’s Absorption of Solutes The adsorption strength of compounds increases with increasing polarity of functional groups, as shown below: -CH=CH2, -X, -OR, -CHO, -CO2R, -NR2, -NH2, -OH, -CONR2, -CO2H. (weakly adsorbed) (strongly adsorbed) (nonpolar) (more polar) Elution Strength of Mobile Phase (e) Elution strength is generally considered to be equivalent to polarity. A solvents elution strength depends on Intermolecular Forces between the solvent and the analytes and between the solvent and the stationary phase. A more polar (or more strongly eluting solvent) will move all of the analytes to a greater extent, than a less polar, weakly elution solvent. For example, the elution strength of hexane is very low; e = 0.01. the elution strength of ethyl acetate is higher; e = 0.45 the elution strength of ethanol is even higher; e = 0.68
Elution Strength of Mixed Solvents The elution strength of the mixture is assumed to be the weighted average of the elution strengths of the components: eonet = eoA (mole % A) +eoB (mole % B) where: mole % A = (moles A) / (moles A + moles B) Thus, to determine the eonet of a solvent mixture, the molar ratio of the solvents must first be calculated. For example, the eonet of a solvent mixture prepared from 1.0 mL of ethyl acetate plus 9.0 mL of hexanes is calculated as shown below: eonet = eoEtOAc [(moles EtOAc)/(moles EtOAc+moles hexane)] + eohexane [(moles hexane)/(moles EtOAc+moles hexane)] where: moles EtOAc = [(volume EtOAc) (density EtOAc)] / [molecular weight of EtOAc] thus: eonet = {0.45[(1.0mLEtOAc)(0.902g/mL)/(88.11g/mole)]+0.01[(9.0mLhexane)(0.659g/mL)/86.18g/mole)]} {(1.0 mLEtOAc)(0.902g/mL)/88.11g/mole) + (9.0 mLhexane)(0.659g/mL)/86.18g/mole)} and eonet = 0.067
Resolution The separation between two analytes on a chromatogram can be expressed as the resolution, Rs and can be determined using the following equation: Rs = (distance between center of spots) (average diameter of spots) In TLC, if the Rs value is greater than 1.0, the analytes are considered to be resolved. x x
Improving Resolution: • For two closely migrating components, optimum resolutions are usually obtained when the Rf’s of both compounds are between 0.2 and 0.5 • * To Improve Rs, change the elution strength of the solvent to optimize Rf’s • change eonet, all compounds will be effected similarly. • Alter the composition of the solvent system so that the components affinity for the mobile phase vs. the solid phase are differentially changed (= change in selectivity). • Changing the chemical nature of the solvent system, such as changing a hydrogen bonding solvent to a solvent which cannot hydrogen bond to the analyte, is often the most effective. • ** Improve Rs by decreasing the diameter of the analyte spots. This can be achieved by applying smaller and less concentrated spots. http://orgchem.colorado.edu/hndbksupport/ TLC/TLCprocedure.html
Detection and visualization • Detection under UV light is first choice - non destructive. • Spots of fluorescent compounds can be seen at 254 nm (short wave length) or at 366 nm (long wave length). • Spots of non fluorescent compounds can be seen - fluorescent stationary phase is used - silica gel GF.