Download
1 / 23
230 likes | 463 Vues
Assessment of TerraSAR-X for mapping salt marsh. Assessment of TerraSAR-X for mapping salt marsh. Yoon-Kyung Lee 1) , Wook Park 1) , Jong-kuk Choi 2) , Joo-Hyung Ryu 2) , Joong-Sun Won 1) 1) Remote Sensing Lab., Yonsei University 2) Korea Ocean Satellite Center, KORDI. Contents. 1.

E N D
Assessment of TerraSAR-X for mapping salt marsh Assessment of TerraSAR-X for mapping salt marsh Yoon-Kyung Lee1), Wook Park1), Jong-kuk Choi2), Joo-Hyung Ryu2), Joong-Sun Won1) 1) Remote Sensing Lab., Yonsei University 2) Korea Ocean Satellite Center, KORDI
Contents 1 Introduction 2 Study area & Data Processing 3 4 Results 5 Summary
Introduction Introduction
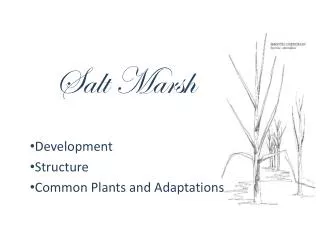
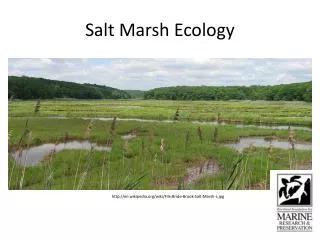
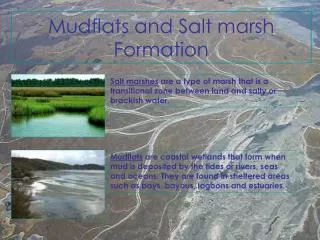
Importance of salt marsh Buffer zone from storms and contaminations (Kirwan and Murray, 2007; Li and Yang 2009) 1 Exchanging materials between tidal flats and open water (Mitch and Gosselink, 2000) 2 Removing large amount of carbon from the atmosphere (Belyea and Warner, 1996; Choi and Wang, 2004) 3 Average global value of salt marsh is 8,535 $/ha/yr (Costanza et al., 1997) 4 Accurate mapping of salt marsh is useful for understanding salt marsh functions and monitoring their response to natural and anthropogenic actions (Barker et al., 2006)
Importance of halophyte Salt marsh vegetation communities (halophyte) play a fundamental role in the topography and stability of coastal wetlands by mean of a soil accretion, resulting from incoming flux of organic matter and sediment trapping. • Elevation of marsh platform in response to rising sea level cause a landward migration of the marsh (Gardner and Porter, 2001). • Equilibrium between mean sea level and interactions of physical factors adjust production of halophytes and location of communities (Morris et al., 2002). • Type of salt marsh (high marsh/low marsh) is altered in response to the environmental change (Bertness et al., 2002) Physical factor Biological factor
Limitation of optical data It is difficult to acquire data over tidal flats at the optimum water condition with cloud free. Aerial photo Landsat ETM+ ; High spatial resolution Low spectral resolution ; Low spatial resolution Medium spectral resolution X-band SAR is suited for the detection and monitoring of herbaceous wetlands because of its short penetration paths to the ground
Objects 1. To differentiate halophyte species based upon radar backscattering characteristics 2. To determine the optimum season of the year and tidal condition for salt marsh mapping 3. To generate salt marsh map
Study area & Data Study area & Data
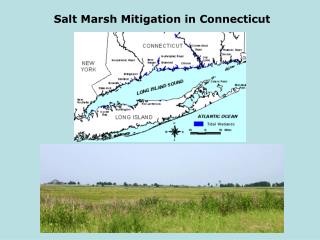
Study area • Located in the mid-west of the Korean Peninsula • Habitat for migratory birds (especially for the endangered species such as spoonbill, crane etc.) • Planned to be nominated as the 1st national tidal flats preservation area. • Halophyte densely development: the western of the Donggum-do bridge, northern part of the Yeongjong-do tidal flat Donggum-do Ganghwa-do Yeongjong-do Inchon internatinal airport TerraSAR-X image acquire on 03, July 2009 (HH pol.)
Main halophyte species Phragmites australis Suaeda japonica • annual • stems grows up to 50cm in height • rapid growth at the beginning of the growth stage • grows in saline soil, but cannot grows in the shadow • the color of short succulent leaves change green to red with an accumulation of red pigment (betacyanin) • perennial • annual shoots emerge from perennial underground of rhizomes • grows in or near fresh water, brackish water • grows up to 3-4m in height
Sudden dieback of S. japonica 18, May 2006 4, May 2009 Possible reasons of sudden dieback : vertical accretion rate, low dissolved oxygen levels, high sulfides, high concentration of nutrients, fungus and sea level rise etc.
Data Field survey Landsat ETM+ 2008: 1/30 (ebb, 611) , 4/19 (ebb, 108) , 5/5 (ebb, 839), 8/9 (ebb, 608), 8/25 (ebb, 630), 9/10 (flood, 540), 10/12 (flood, 291), 12/15 (flood, 106) 2009: 2/1 (ebb, 501), 3/21 (flood, 510), 4/6 (flood, 392), 5/8 (ebb, 134), 5/24 (flood, 210), 8/28 (ebb, 574), 9/13 (ebb, 603), 10/15 (flood, 493), 12/18 (ebb, 78) 2010: 1/3 (ebb, 114), 2/4 (ebb, 513), 4/9 (flood, 507), 9/16 (ebb, 504), 10/18 (flood, 460) 2010.05.12 2010.07.12 2010.08.20 2010.09.16 Field survey Landsat ETM+ TerraSAR-X TerraSAR-X HH 2008: 6/13 (ebb, 225), 7/27 (flood, 272), 10/12 (ebb, 425), 11/25 (ebb, 362), 12/06 (flood, 378) 2009: 4/17 (flood, 466), 7/3 (ebb, 273), 12/15 (ebb, 618) 2010: 3/24 (flood, 347), 7/1 (flood, 464), 9/5 (flood, 421) VV/VH 2008: 7/11 (flood, 315), 9/24 (flood, 431), 10/5 (flood, 685)
Processing Decision tree GPS Statistical analysis TerraSAR-X - SLC data converted to the MLI data - Georectified using orbit - The SAR intensity values were converted to sigma naught
Results Results
SAVI (Soil adjusted vegetation index) Phragmites australis Suaeda japonica Tidal flats • The seasonal variation pattern of SAVI matched well with phenelogical cycle of halophyte • P. australis and S. japonica is hard to be distinguished from SAVI • P. australis, S. japonica and tidal flats have similar SAVI values during winter
Characteristics of sigma naught (HH) - 1 • Almost 350 pixels for each classes • The quality of sigma naught were identified using average of industrial area • P. austalis: • - slightly stable and higher than S. japonica • S. japonica: • - lower value in winter and increased from spring to peak in summer • Tidal flats: • - significant variation according to surface condition • - remnant water within the ripple control the backscattering Industrial area P. austalis S. japonica Tidal flats Water
Characteristics of sigma naught of halophyte on-season P. australis S. japonica Sigma Naught (dB) Sigma Naught (dB) • Temporal variation of sigma naught during 3 years • - P. australis: not agree with its plant cycle • - S. japonica : peak in summer to autumn, presence of S.japonica structure roles as scatter although it is dead in Nov. • Difference between S. japonica and P. austalis • - Increased in winter, decreased from summer to autumn
Characteristics of sigma naught (VV/VH) P. australis S. japonica • Similar value in VV also between halophytes during Nov. (Park et al., 2010) • The average VV/VH difference of S. japonica: • 6.2 dB (from image), 10.2 dB (from field survey)
Consideration tidal condition Sigma naught (dB) Water P. australis S. japonica Tidal flats • Ebb condition during the off-season is the best condition to distinguish between P. australis and S. japonica • Ebb condition is good to distinguish halophyte
Decision rule based on statistical analysis Mean difference of sigma naught (T-test) HH <-23.57 dB In flood (on-season) HH > -19.28 dB in ebb (on-season) HH > -9.43 dB in ebb (off-season) HH > -16.16 dB in flood (rains)
Salt marsh map • Total accuracy: 66.5 %
Summary Optimum data acquisition plan by high resolution spaceborne X-band SAR should focus on on-season on the ebb tide when the halophyte return the strongest signal and off-season on the ebb tide to distinguish annual and perennial. 1 Generated salt marsh map has 66.5 % total accuracy. 2 For long-term monitoring the distribution of S. japonica in association with sea level fluctuation, it is important to set up date for annual data acquisition. 3
Thank you for your attention. Thank you for your attention.