SALT MARSH MODELS
APALACHICOLA BAY WATER QUALITY MODEL. RISK ASSESSMENT SCENARIOS. SALT MARSH MODELS. OYSTER MODEL. APALACHICOLA BAY HYDRO- DYNAMIC MODEL. APALACHICOLA BAY LANDSCAPE GIS. HABITAT SUITABILITY MODEL. APALACHICOLA RIVER MODEL.

SALT MARSH MODELS
E N D
Presentation Transcript
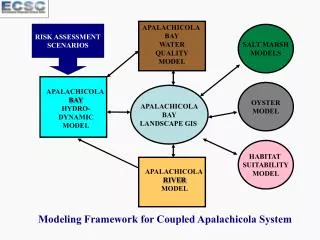
APALACHICOLA BAY WATER QUALITY MODEL RISK ASSESSMENT SCENARIOS SALT MARSH MODELS OYSTER MODEL APALACHICOLA BAY HYDRO- DYNAMIC MODEL APALACHICOLA BAY LANDSCAPE GIS HABITAT SUITABILITY MODEL APALACHICOLA RIVER MODEL Modeling Framework for Coupled Apalachicola System
Calibration of MODBRNCH for the Apalachicola River Basin Main Property of Interest: Flow Rates Calibration Procedure: Adjust parameters to attain good agreement between measured and calculated flow rates. Parameters of Main Importance 1) Flows at External Junctions: Flow at the Chattahoochee and the Sumatra gauges 2) River-Aquifer Leakage Coefficient 3) Manning Roughness Coefficient for the river 4) Gradient of the riverbed
The Apalachicola River extends from Woodruff Dam to Apalachicola Bay. The distance from the Chattahoochee to the Sumatra gauge is 85.4 miles. The Chipola River is the main tributary of the Apalachicola River; it flows into the Apalachicola above the Sumatra gauge station. Sumatra
APALACHICOLA BAY WATER QUALITY MODEL RISK ASSESSMENT SCENARIOS SALT MARSH MODELS OYSTER MODEL APALACHICOLA BAY HYDRO- DYNAMIC MODEL APALACHICOLA BAY LANDSCAPE GIS HABITAT SUITABILITY MODEL APALACHICOLA RIVER MODEL Modeling Framework for Coupled Apalachicola System
Flow diagram of soil salinity modeling in the salt marsh model improved from Morris (1995). Solar Radiation Tide Height > Site Elevation ? Daily ET (P-M Equation) Yes: High Tide No: Low Tide Vapor Pressure Air Temperature Hourly ET Canopy Resistance Hourly Tide (height+salinity) Porewater Volume: Floodwater infiltration (+), Rainfall(+), ET (-) Salt Content: Infiltration of salt (+), salt diffusion (-) Porewater Volume: Rainfall(+), ET(-), Drainage(-) Salt Content: Salt drainage(-), salt secretion(-) Hourly Rainfall Soils (k,fc,p,Kd,Sc) Soil Salinity (Mass Balance Equation)
Marsh characterization (under NOAA funding) • Sediment cores and ground truth data representing different vegetation patches (such as black needlerush and sawgrass) were collected in the Apalachicola Reserve, FL on March 31, 2004. • Ground truthing will be used for vegetation classification. Sediment cores will be used to investigate salinity control over the vegetation distribution. • The sampling trip was spearheaded by Prof. Y. Hsieh of Florida A&M University (FAMU), and included FAMU Research Associates Kevin Dillon and Glynnis Bugna, and Lauren Levi of the Apalachicola National Estuarine Research Reserve (ANERR).
APALACHICOLA BAY WATER QUALITY MODEL RISK ASSESSMENT SCENARIOS SALT MARSH MODELS OYSTER MODEL APALACHICOLA BAY HYDRO- DYNAMIC MODEL APALACHICOLA BAY LANDSCAPE GIS HABITAT SUITABILITY MODEL APALACHICOLA RIVER MODEL Modeling Framework for Coupled Apalachicola System