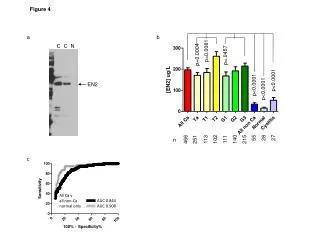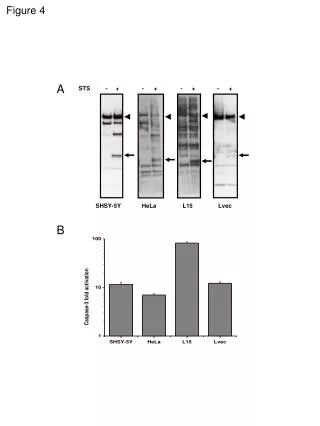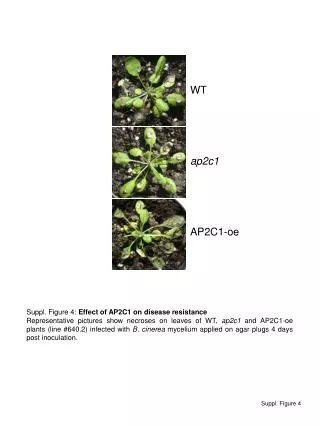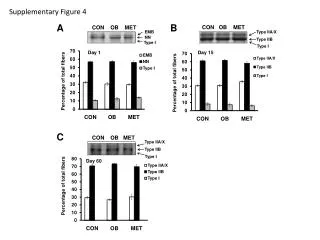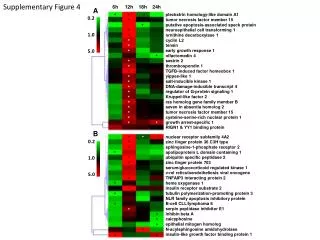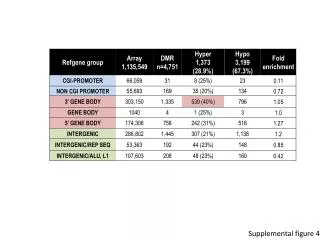
Figure 4
kDa. 50 m m. 50 m m. 50 m m. 50 m m. 50 m m. 50 m m. 50 m m. 50 m m. kDa. cl. PARP. 89. 22. Bid. pro-caspase-8. 15. tBid. 29. Bcl-2. cl. caspase-8. 30. Bcl-x L. cl. caspase-8. Mcl-1. 40. 1 6. G3PDH. survivin. cl. lamin A. 40. b -actin. pro-caspase-2. Bax. 21.
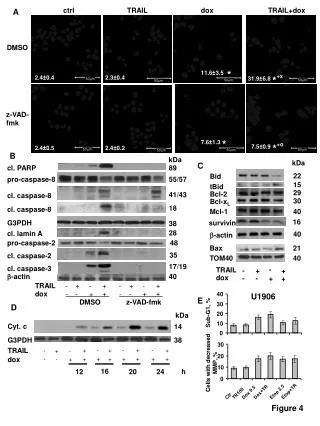

Figure 4
E N D
Presentation Transcript
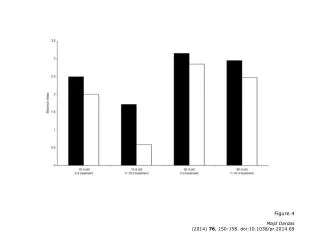
kDa 50mm 50mm 50mm 50mm 50mm 50mm 50mm 50mm kDa cl. PARP 89 22 Bid pro-caspase-8 15 tBid 29 Bcl-2 cl. caspase-8 30 Bcl-xL cl. caspase-8 Mcl-1 40 16 G3PDH survivin cl. lamin A 40 b-actin pro-caspase-2 Bax 21 cl. caspase-2 TOM40 40 cl. caspase-3 - TRAIL - + + b-actin dox - - + + + TRAIL + - + - - + - + - - + + dox - - + 40 U1906 30 kDa Sub-G1, % 20 Cyt. c 10 14 0 G3PDH 38 30 TRAIL + + - + - - + - + - 20 + dox + + + + + + - - + Cells with decreased MMP, % 10 16 12 20 24 h 0 Etop+TR Etop 2.5 Dox+TR Dox 0.5 TR100 Ctr ctrl TRAIL dox TRAIL+dox A DMSO 11.6±3.5 * 31.9±6.8 *+x 2.4±0.4 2.3±0.4 z-VAD- fmk 7.6±1.3 * 7.5±0.9 *+o 2.4±0.5 2.4±0.2 B C 55/57 41/43 18 38 28 48 35 17/19 40 E DMSO z-VAD-fmk D Figure 4